


Measuring Income Inequality
24 Jun 2014Introduction
This report will illustrate Irelands’ current situation as regards Income Inequality. It will focus on the most recent data released from the Survey on Income and Living Conditions (SILC) and will look at the Gini Coefficient, the at-risk-of-poverty Indicator, the Income Quintile Share Ratio and Interdecile Ratios similar to the last report. It will also include a new indicator of income equality called the Palma Ratio which may be more accurate than the Gini Coefficient in highlighting where the inequality lies in an economy.
Gini Coefficient
The Gini Coefficient measures the degree of inequality in the distribution of family income in a country. The Gini Coefficient is valued at between 0 and 1; with 0 being perfect equality and 1 being perfect inequality. If measured as a percentage, 100% implies complete inequality with one person holding all of the income in a country.
Table 1 illustrates that in 2012 Ireland had a Gini of 31.2%, compared to an EU average of 30.6%, and is ranked 21st out of 31 EU member countries in terms of income equality (Norway, which is ranked 1st is the most equal, while Latvia is the most unequal and is ranked 31st). The Gini Coefficient is statistically unchanged from 2011 when it was measured at 31.1%; however it is also worth noting that during this period the EU average Gini Coefficient fell so that Ireland’s position relative to the EU average deteriorated.
Table 1: 2012 Gini Coefficients for Ireland and the other EU member countries and their respective rankings
[table id=33 /]
While the Gini Coefficient is the most commonly used measure of income inequality, it is silent on where in the income distribution inequality is taking place. Several ancillary measures have been developed that focus on measuring certain types of inequality.
Income Quintile Share Ratio
The income quintile share ratio focuses on comparing the incomes of those at the top of the income distribution to those at the bottom. It is calculated as the ratio of the average equivalised income received by the 20% of persons with the highest income (top quintile) to the average equivalised income received by the 20% of persons with the lowest income (bottom quintile). Irelands ranks marginally below the EU average, which is 5.1, with a value of 5 in 2012. This indicates that in 2012 the top 80% of Irish earners earned 5 times more than those individuals in the lowest income quintile.
Table 2: Income Quintile Share Ratio, 2012
[table id=34 /]
Interdecile Ratios
Interdecile ratios are another method available to measure income inequality. Interdecile ratios compare disposable income between different income groups. There are three Interdecile ratios used; the first compares income in the highest income decile to that in the lowest and it is called the P90/P10 ratio. The ratio of those in the highest decile to those in the median income decile is the P90/P50 ratio. The final Interdecile ratio used is the P50/P10 which is the ratio of the median deciles’ disposable income to the disposable income of those in the lowest decile.
Table 3 provides a list of the three different Interdecile Ratios for Ireland and the other OECD countries for 2011. It can be seen that the disposable income of middle income earners in Ireland is 1.87 times larger than the disposable income of those at the bottom of the income distribution, and that the disposable income of those at the top of the income distribution is 2.02 times larger than middle income earners. It also shows that those in the highest income bracket earn 3.78 times more than those in the lowest bracket.
It can be seen in Table 3 that while Ireland scores worse than the OECD average in all three categories, income disparities between those in the middle of the distribution and those at the bottom are particularly unequal relative to the OECD average.
Table 3: Interdecile Ratios for Ireland and other OECD countries, 2011
[table id=35 /]
Note: Calculations for average decile figures are authors’ own.
The Palma Ratio
The Chilean economist Gabriel Palma observed that the income share of those in deciles 5 to 9 is usually stable, around 50% – across countries and across time. The remaining 50% is shared amongst the very top earners in decile 10 and those in deciles 1 to 4, but its distribution varies widely between countries and across time. This observation led to the development of the Palma Ratio by two economists, Alex Cobham and Andy Sumner, who state that it gives a more accurate picture of income inequality than the Gini Coefficient because the Gini is not sensitive to data in the tails, where the inequality actually lies. The Palma Ratio, which compares the share of income of the richest 10% in a society to that of the poorest 40%, focuses on the locus of inequality, and is also sensitive to extreme inequality unlike the Gini.
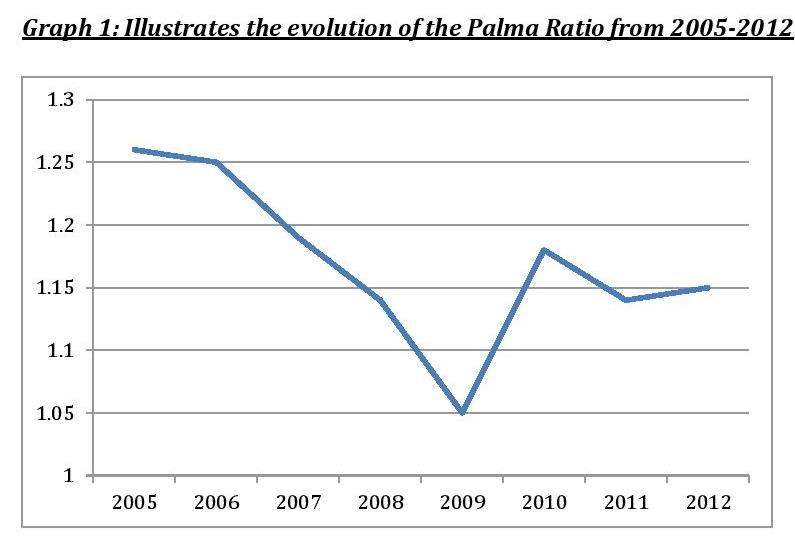
Using the data supplied in the recent EU SILC publication it was possible to compute the Palma ratio for Ireland. The income share of the top 10% of earners is 24%, compared to an income share of 20.8% for the bottom 40% of income earners, which gives a Palma Ratio of 1.15.
Graph 1 illustrates the Palma Ratio for Ireland and how it has evolved over the recent past. Up until 2009, the Palma Ratio had been falling steadily, indicating that the income share of the bottom 40% was increasing relative to the income share of the top 10%. The situation worsened in 2010 when the Palma rose from 1.05 to 1.18, and has since remained relatively stable. The Palma Ratios for 2005 through to 2012 were calculated using the income shares per decile provided in the SILC report.
About author
Related Articles


79 Merrion Square, Dublin 2, Ireland
tel: 353 (1) 676 0414 | email: info@publicpolicy.ie
Company registration number: 504956
Privacy Policy | Chairman's Blog | Events | Video | Public Policy Documents | News Property Tax Ireland | Pension Reform Ireland | Water Charges Ireland