

Ireland’s Current Fiscal Profile
9 May 2013Introduction
This note sets out the key facts in relation to the current Irish fiscal position as at May 2013.
Total Government Revenue in 2012 was €41.8bn compared with Total Expenditure of €56.6bn leaving an Exchequer Balance of €14.9bn. The Underlying General Government Deficit (GGD) was €12.5bn or an estimated 7.6% of GDP according to the latest Department of Finance Forecasts. Ireland is committed to reducing the GGD to below 3% of GDP by 2015.
Fiscal consolidation is planned to continue for at least another two years. A further €5.1bn in adjustments is to be implemented in Budget 2014 and Budget 2015.
The latest official forecasts for the period 2013-2015 are set out in the following Table:
1.1 – General Government Balance and Fiscal Consolidation Forecasts 2013-2015
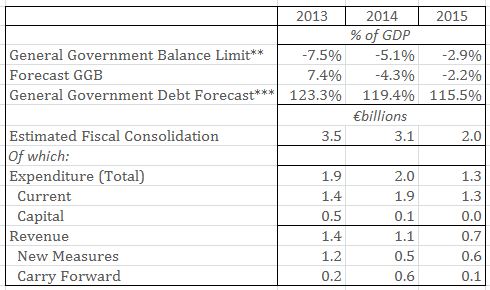
*Source: Stability Programme Update April 2013, Department of Finance
**-as set by ECOFIN Council
***Post-Promissory note transaction i.e. accounts for this manoeuvre
The above table shows that forecasts for the GGD were just within the parameters set out by ECOFIN prior to the promissory note deal. On February 7th and into the early hours of the morning of February 8th the Oireachtas enacted legislation to liquidate the Irish Bank Resolution Corporation (IBRC), winding down the former Anglo Irish Bank and Irish Nationwide Building Society (INBS). Under the deal, the liabilities of Anglo Irish Bank and the scheduled annual promissory note payments of €3.1bn were converted into long-term bonds with a much longer length of maturity. The first principal payment on these bonds will be made in 2038, with the final payment to be made in 2053. The deal results in the NTMA’s borrowing requirement being reduced by €20bn over the next decade.
However, significant fiscal challenges remain with General Government expenditure exceeding General Government revenue for the foreseeable future.
General Government Revenue
Current receipts for 2012 were €39.5bn, comprised of tax revenue of €36.6bn and non-tax revenue of €2.8bn. The biggest component of tax revenue in 2012 was Income Tax, which constituted 41.4% of the tax take. Value Added Tax (VAT) was the second biggest tax heading, constituting 27.8% of the total tax take.
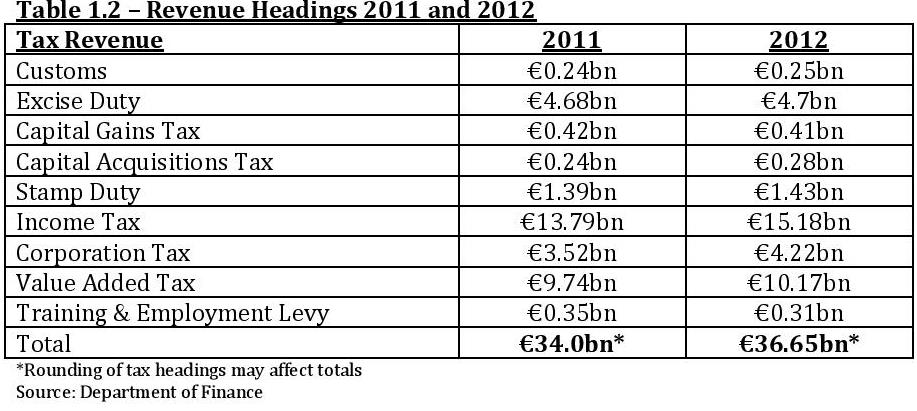
Table 1.3 Composition of 2012 Tax Revenue
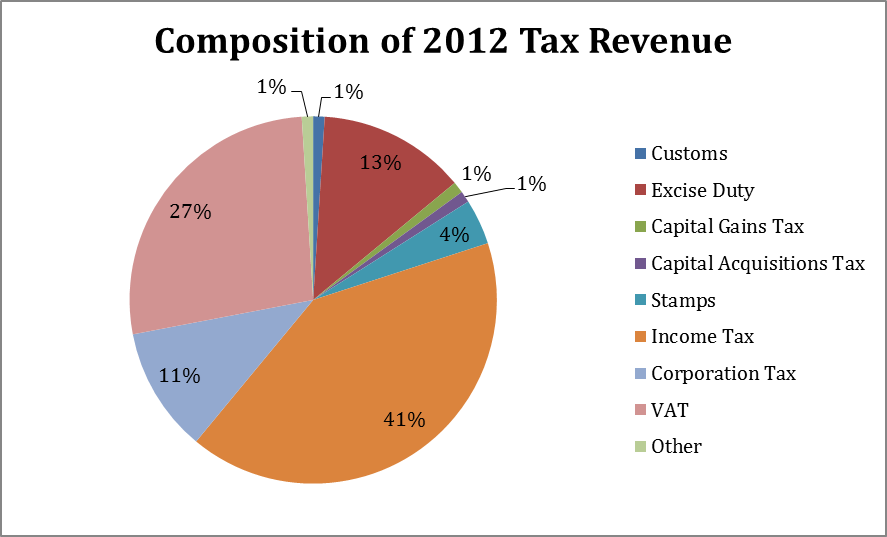
Source: Department of Finance
The main contributors to the tax take are income tax, VAT, Excise Duty and corporation tax which between them account for 92% of the tax take. Stamp duties now only contribute 4% to total revenue, compared with 8% at the height of the Celtic Tiger period.
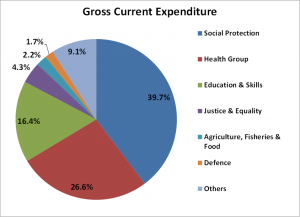
General Government Expenditure
General Government expenditure has increased since 2008 despite the implementation of fiscally austere policies. As can be seen from the Table 1.4 below, by far the largest portion of current government expenditure is in the area of Social Protection, which accounts for just under 40% of total gross current spending. Spending on Social Protection has increased 34% since 2007 as a result of the recession – Irish unemployment has effectively tripled from just 4.7% in 2007 to 14.6% in 2011 and remains at remains stubbornly high with the standardized unemployment rate currently at 14%.
The other main areas of government current expenditure are Health, which accounts for 26.6% of total current expenditure, and education, which accounts for 16.4%
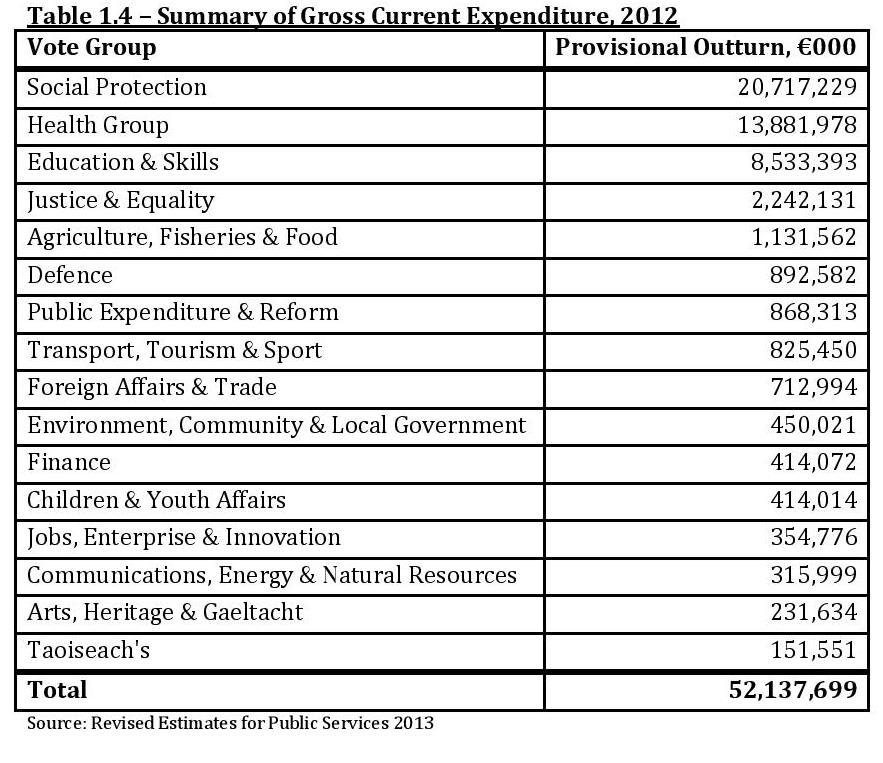
Table 1.5 – Breakdown of current Government Expenditure 2012
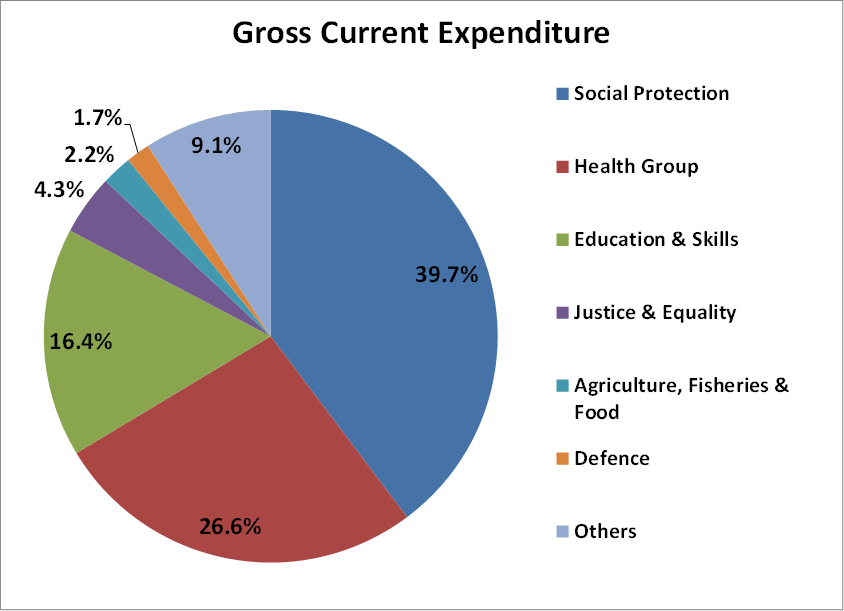
Source: Revised Estimates for Public Services 2013
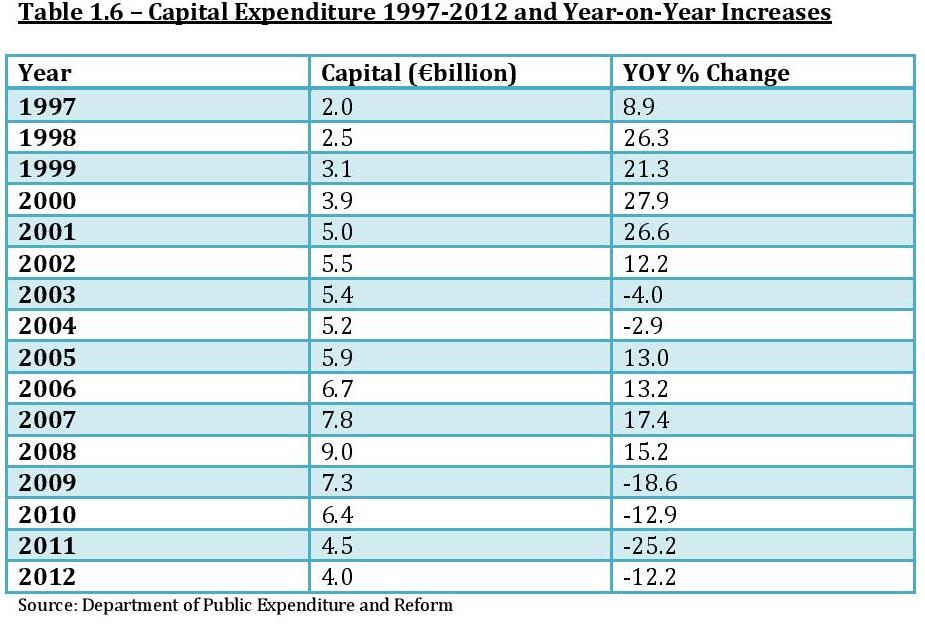
Table 1.6 shows annual capital expenditure by the state from 1997 to 2012. The peak in capital expenditure was in 2008 when €9bn was spent and has fallen to under €4bn in 2012 representing a fall in capital expenditure of 56%. Capital expenditure was reduced by a further €0.55bn in Budget 2013 and an additional €0.1bn in savings via capital expenditure is planned for Budget 2014.
The Deficit – General Government Balance
Since 2008, the public finances have come under increased strain due to a collapse of tax revenues and an increase in expenditure on social transfers and debt servicing costs. Table 1.7 depicts the deterioration of the underlying General Government Balance (i.e. excluding once-off bank recapitalisation costs) from a small surplus in 2007 to a large deficit of -11.5% in 2009.
Table 1.7 – Underlying General Government Balance 2007-2016 Forecast*
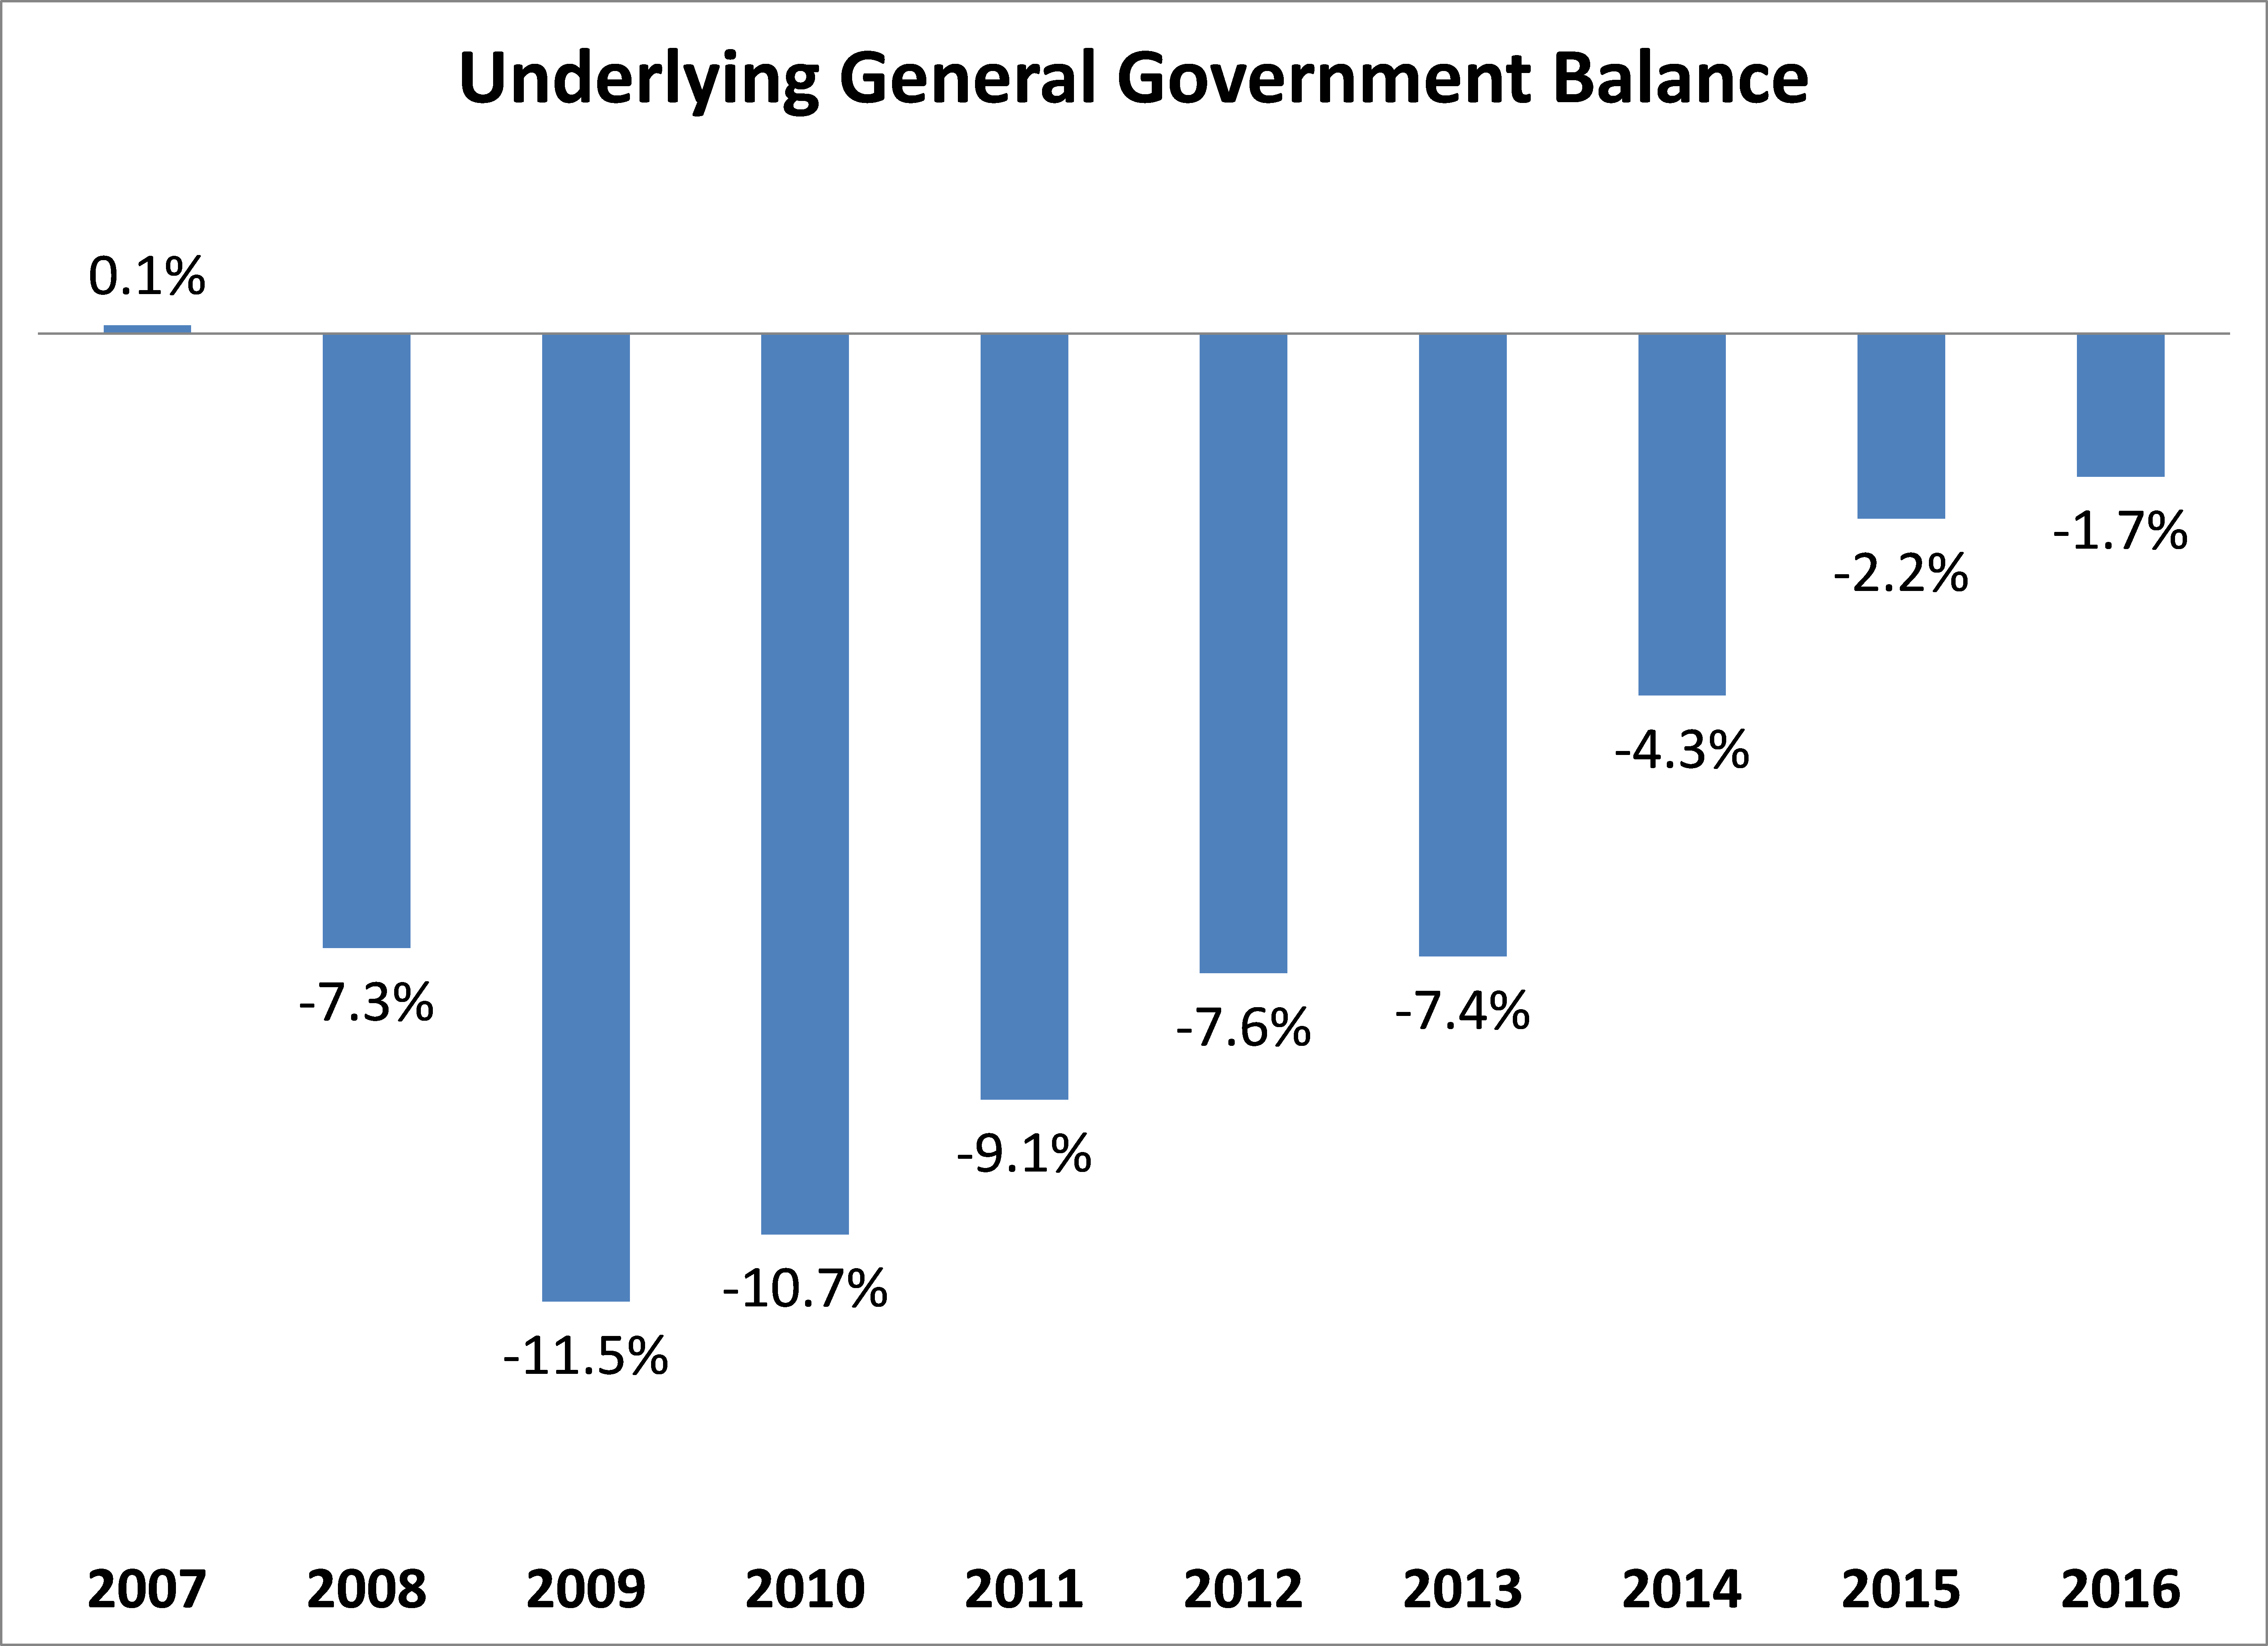
Source: Department of Finance
As can be seen from the graph above, the deficit has been gradually falling since 2009. Due to a Eurostat ruling, the recorded deficit for 2010 was 32% but the underlying General Government Balance is shown above at -10.7%. The GGB for 2012 was -7.6%, considerably below the ECOFIN target of 8.6%.
Debt/GDP Ratio
Although progress has been made in terms of deficit reduction, due to the running of large fiscal deficits for the last number of years the indebtedness of the Irish sovereign has increased dramatically. The cumulative effect of running large deficits has been a significant increase in the debt burden.
Table 1.8 – Ireland’s General Government Debt 2007-2016 Forecast
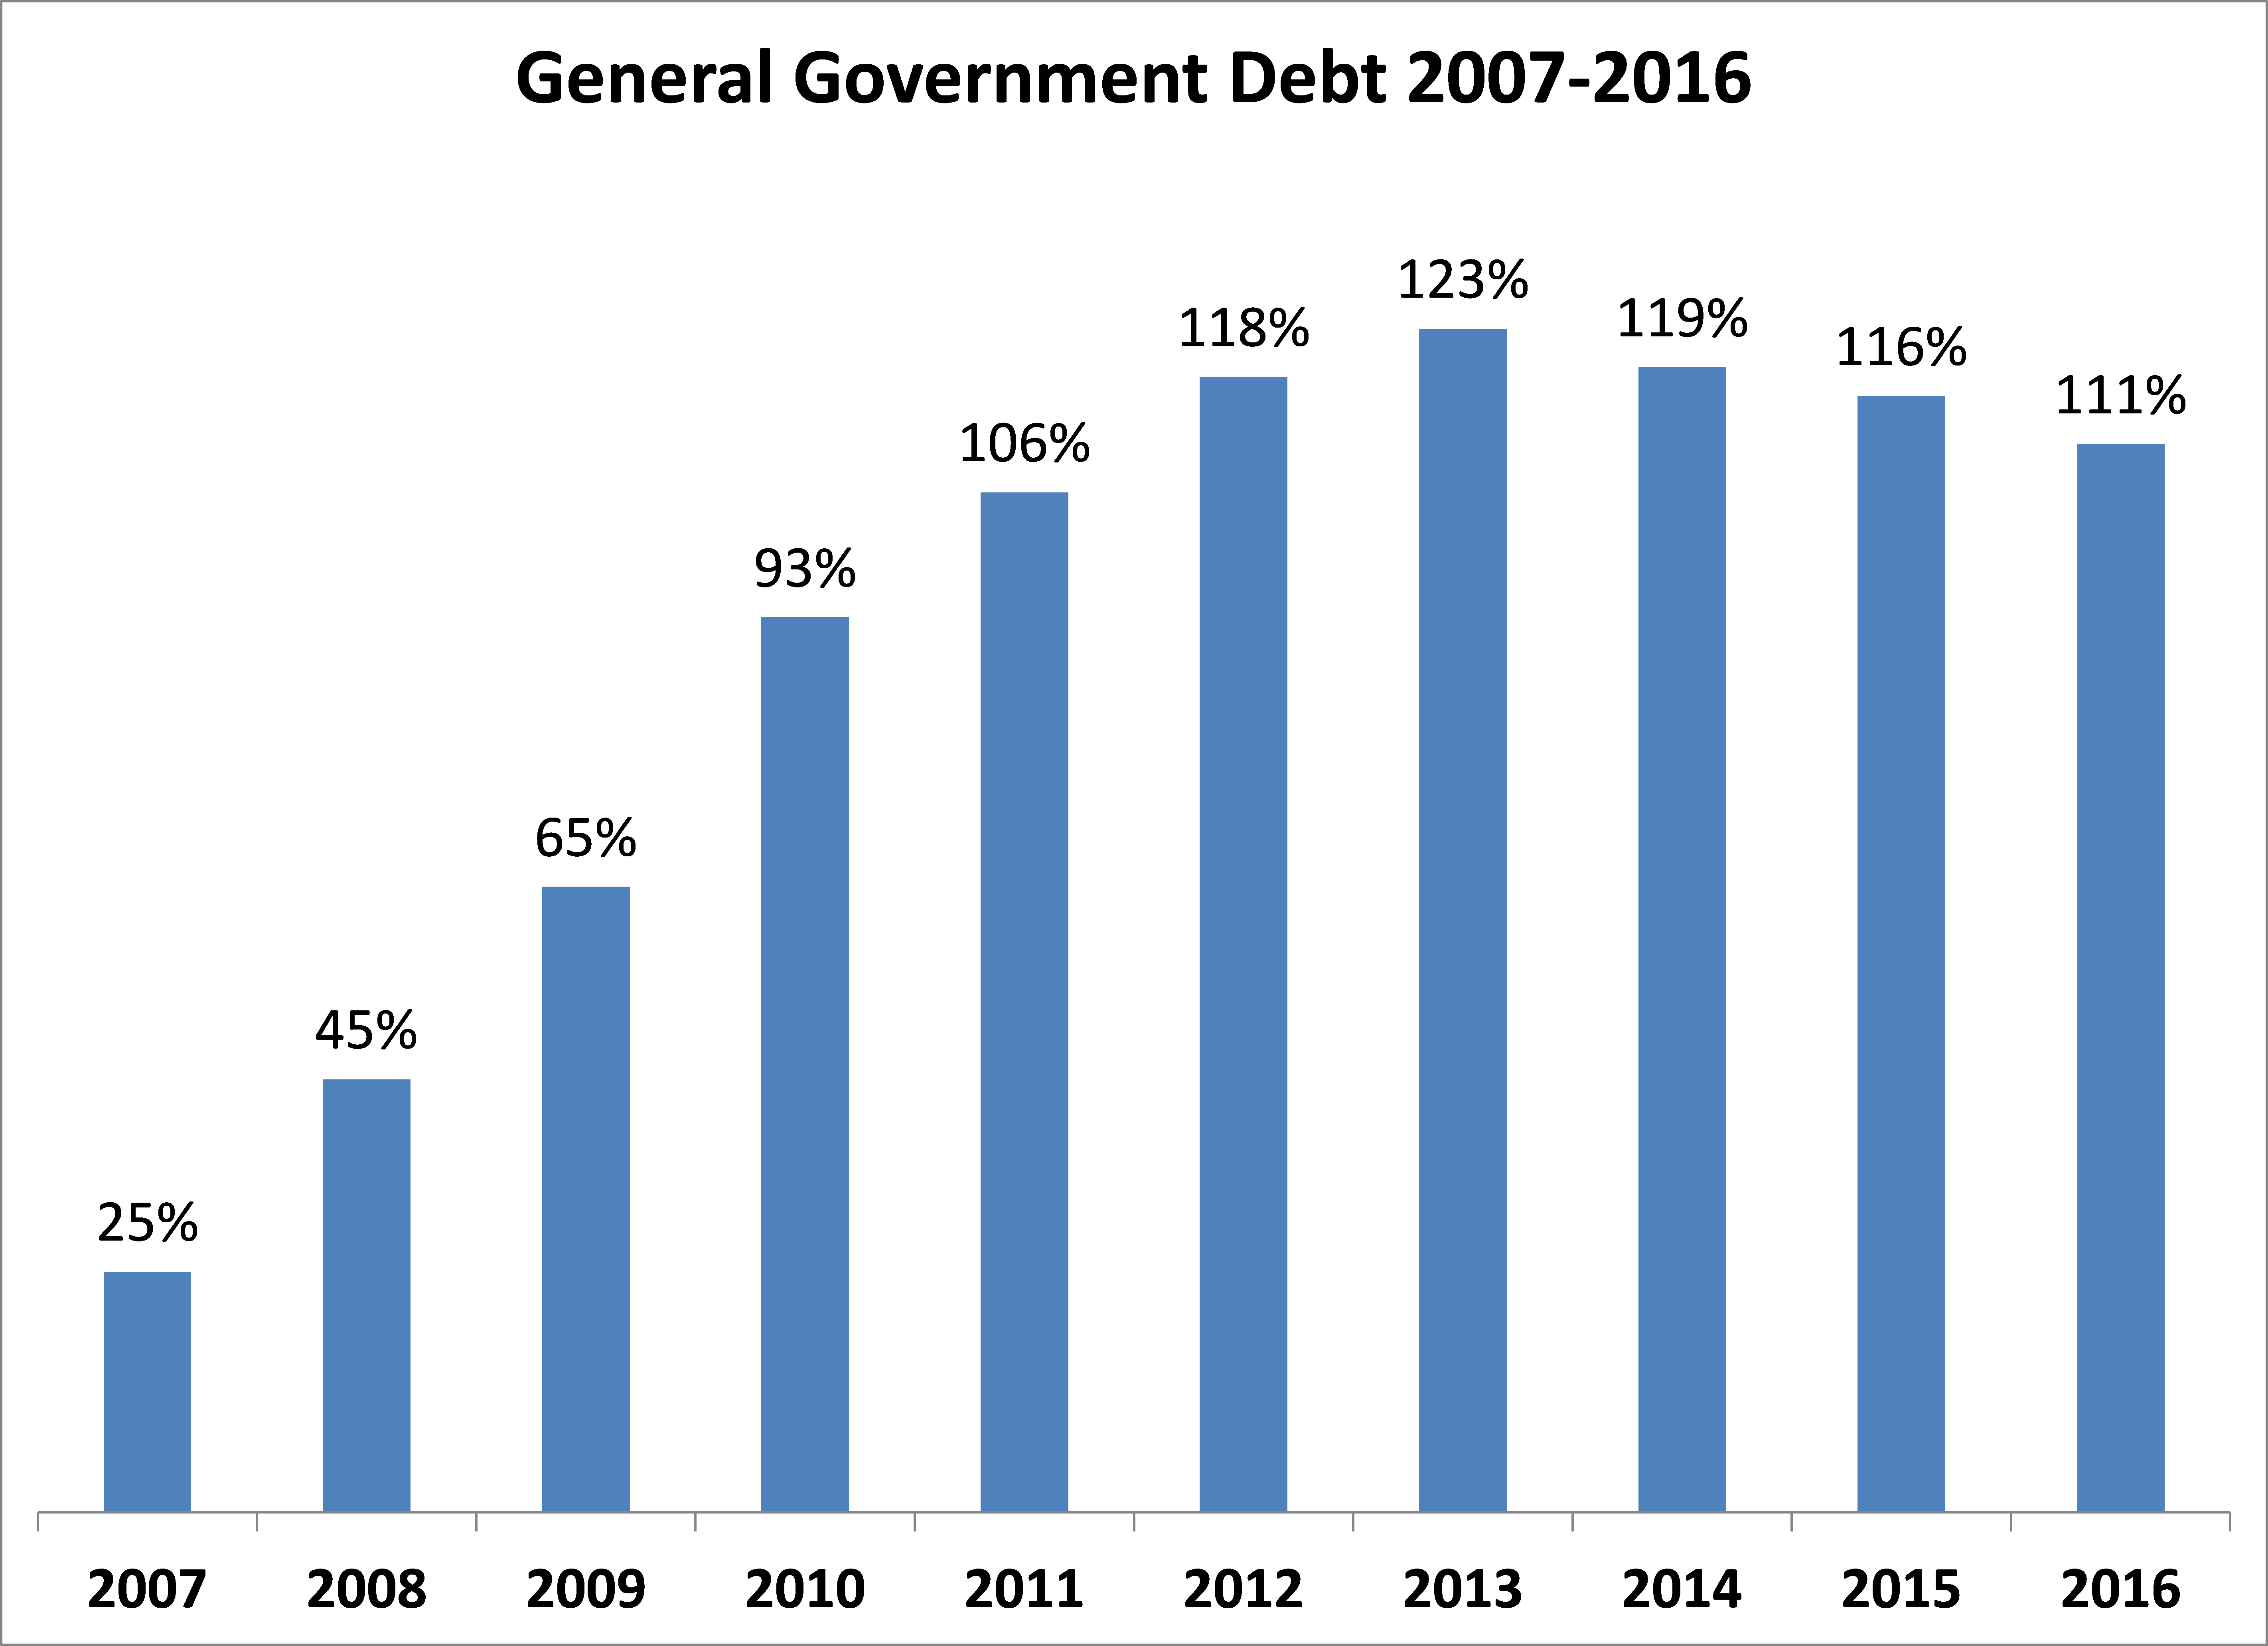
Source: Department of Finance
Ireland’s General Government Debt relative to GDP is currently the fourth highest in the EU27. The indebtedness of the Irish sovereign has more than quadrupled since 2006 rising from 24.6% in 2006 to 118% by 2012. The debt-to-GDP ratio is expected to peak in 2013 at 123% and fall gradually in the years thereafter. It is important to note that these numbers represent the gross debt position. When account is taken of the sizeable holdings of cash and other financial assets held by the government, the net debt-to-GDP ratio for 2013 is estimated to be 98%.
The significant debt burden of the Irish sovereign will act as a drag on economic activity in the years ahead, and reduces the government’s capacity to respond to future crises.
Tagged with:
Fiscal Policy
About author
Related Articles
-
-
Ireland’s Fiscal Profile – Q4 2014
26 Nov 2014 -

Fiscal Update Q2 2014: Austerity Fatigue
13 Aug 2014 -

Fiscal Update – Q1 2014
18 Apr 2014
79 Merrion Square, Dublin 2, Ireland
tel: 353 (1) 676 0414 | email: info@publicpolicy.ie
Company registration number: 504956
Privacy Policy | Chairman's Blog | Events | Video | Public Policy Documents | News Property Tax Ireland | Pension Reform Ireland | Water Charges Ireland