

Where Do The Jobs Come From?
9 Feb 2017Introduction
This note examines the changes in the structure of employment in the Irish economy since the turn of the century. The service sector is the key driver of job creation.
Employment 2000-2016
Employment in 2016 Q3 at 2,040,500 was 305,100 greater than in 2000 Q3. Over this period the numbers employed in agriculture (incl forestry and fishing) fell by 11,000, industry fell by over 55,000, construction fell by 30,000, while services grew by 408,000.
The shares are shown in the following pie charts.
Figure 1 – Sectoral Employment Shares, 2000 and 2016
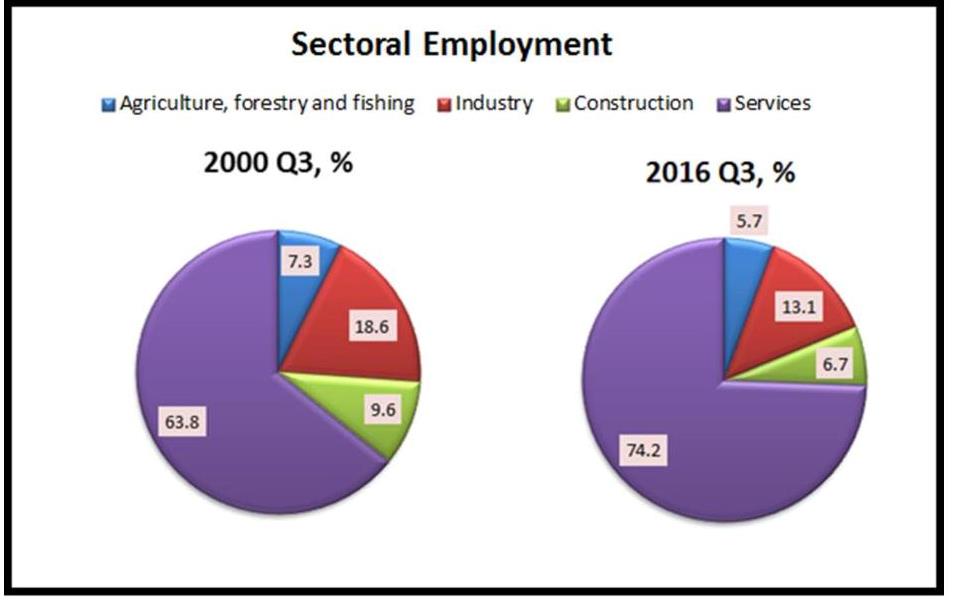
(Source: CSO, QNHS)
Employment peaked in 2007 Q3 at 2,169,600 and is currently 129,000 below that level. However, in 2007 employment in construction was at an unsustainable level of almost 271,000. Excluding construction, employment is now 5,000 above its 2007 level.
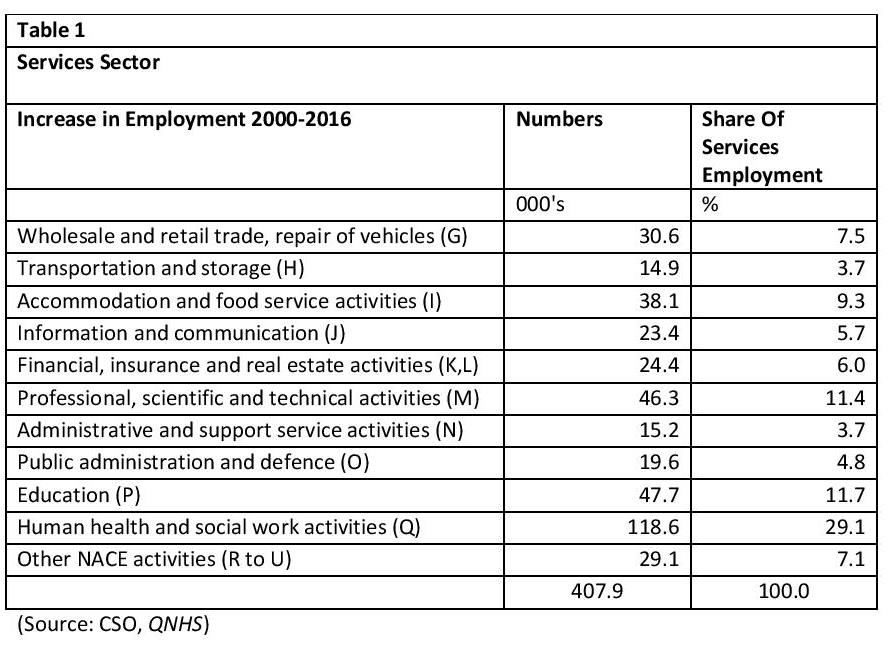
Services Sector Employment
The services sector is the driver of growth in employment. While all services sub-sectors have experienced growth, the most dynamic sectors are health and social work, education and professional, scientific and technical activities. Hospitality and wholesale and retail sectors are also significant contributors to job creation.
The data is in Table 1.
About author
Related Articles
-
-

Involuntary Part-time Work
28 Jun 2017 -

-

The Best Solution To Poverty Is Job Creation
15 Sep 2015
79 Merrion Square, Dublin 2, Ireland
tel: 353 (1) 676 0414 | email: info@publicpolicy.ie
Company registration number: 504956
Privacy Policy | Chairman's Blog | Events | Video | Public Policy Documents | News Property Tax Ireland | Pension Reform Ireland | Water Charges Ireland