

Where Have The Extra Jobs Been Created?
4 Oct 2017Key Point
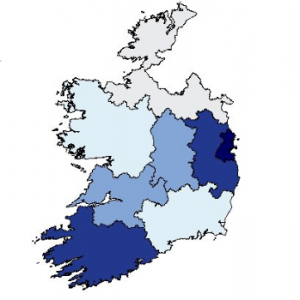
Employment in Ireland is now over 2 million. It is 4.9 per cent below the peak reached in Q3 2007 (2.17 million) and 13 per cent above the low point reached in Q1 2012 (1.8 million). The greatest recovery from the low point has been in the Midlands Region, with the lowest being in the West. Just one-third of the extra jobs created since the low point have been in Dublin.
Introduction
This note examines the evidence from the Quarterly National Household Survey (QNHS) produced by the CSO.
Employment by Region
The number of people employed in each of the eight regions from the lowest point in the downturn relative to the second quarter of 2017 (Q2) is shown in table 1.
Table 1- Employment by Region, Low Point to Q2 2017
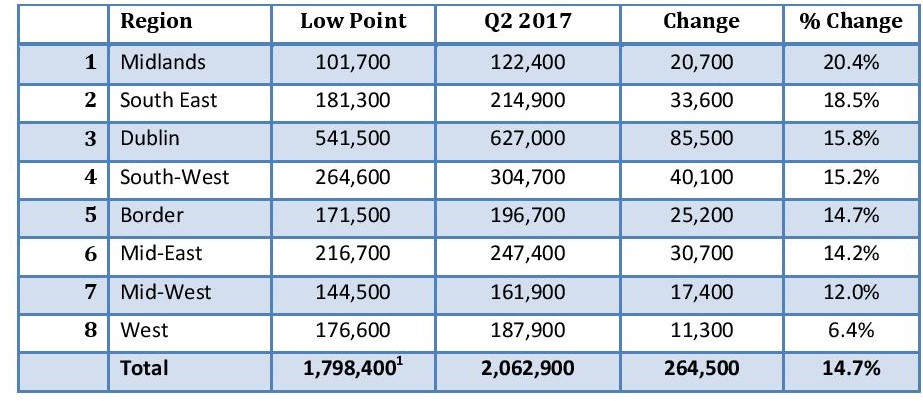
(Source: CSO, QNHS)
Table 1 shows that the highest absolute increase in employment has been in Dublin, where jobs have increased by 85,500 since the low point of 541,500 as found in Q1 2012. Employment in the Midlands has increased the most in percentage terms (20.4%) since the low point of 101,700 (Q3 2011) to 122,400 in Q2 2017. Employment in the Midlands was highest in Q3 2007 with 127,700 people employed. Therefore, the Midlands is 4.2% or 5,300 short of peak employment.
The West has experienced the lowest recovery in the number of jobs from its low point of 176,600 (in Q1 2016) to its current rate of 187,900. Employment was at its highest in the West in Q2 2008 at 207,400 – thus it is 9.4% or 19,500 off this peak employment figure. Of the extra 264,500 jobs, just one-third (32.3%) have been created in Dublin.
Table 2 shows peak employment numbers in the eight regions relative to Q2 2017.
Table 2 – Employment by Region, High Point to Q2 2017 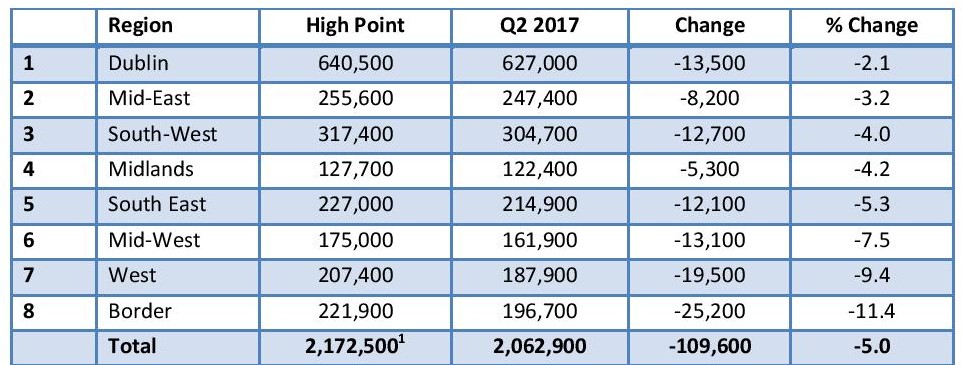
(Source: CSO, QNHS)
As shown in table 2, the Dublin region is the closest (-2.1%) to returning to peak employment experienced in Q3 2007, followed by the Mid-East (-3.2%) and the South-West (-4.0%). The Border (-11.4%), the West (-9.4%) and the Mid-West (-7.5%) have the largest gaps to close to return to peak employment numbers.
Unemployment by Region
Unemployment decreased by 46,300 (-25%) in the year to Q2 2017 bringing the total number of persons unemployed to 141,500. The unemployment rate has varied significantly in different regions in recent years.
Table 3 highlights the fact that the South East region had the highest unemployment rate in the country at 20.1% between the period of 2011 and 2013. Dublin’s unemployment rate peaked at 13.4% in Q3 2011.
Table 3 –Unemployment Rate by Region, Peak and Q2 2017 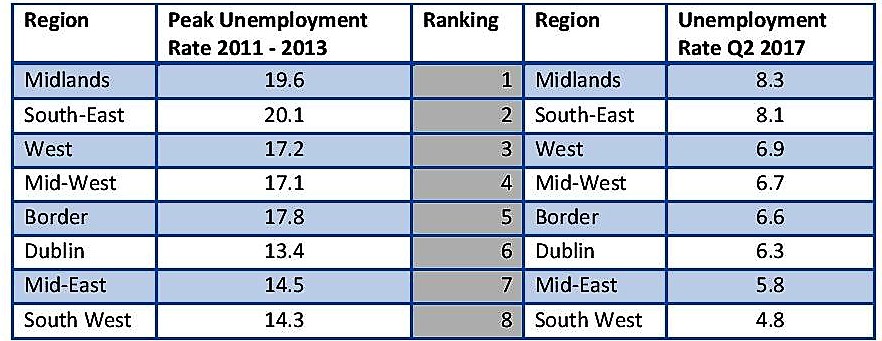
(Source: CSO, QNHS)
The unemployment rate has fallen faster in particular regions. Table 3 shows that the South East region (Carlow, Kilkenny, South Tipperary, Waterford City & County, and Wexford) has seen its unemployment rate fall the most in percentage terms (-12 pp) from its peak. The percentage point decrease in the unemployment rate of the other 7 regions ranks as the Midlands (-11.3pp), the Border (-11.2pp), the Mid-West (-10.4%), the West (-10.3pp), the South-West (-9.5pp), the Mid-East (-8.7pp) and Dublin (-7.1pp).
_________________________________
Notes:
1 Note that low point employment by region is taken from different quarters which affect the total.
2 Note that high point employment by region is taken from different quarters which affect the total.
About author
Related Articles
-
-

Social Protection Spending 2016
1 Feb 2018 -

Labour Activation Programmes
23 Jan 2018 -

Large Increase In Homelessness
15 Nov 2017
79 Merrion Square, Dublin 2, Ireland
tel: 353 (1) 676 0414 | email: info@publicpolicy.ie
Company registration number: 504956
Privacy Policy | Chairman's Blog | Events | Video | Public Policy Documents | News Property Tax Ireland | Pension Reform Ireland | Water Charges Ireland