


Social Protection Spending 2016
1 Feb 2018
Key Point
Social Protection payments continued to be the largest component of Government spending in 2016, totalling €19.87 billion. The updated ‘Survey on Social Benefits’ provides key information on social protection payments, including recipient numbers and expenditure on more than 60 different schemes. Comparisons with equivalent social benefits in the UK are also provided. You can read the full Survey here.
Social Protection System
The Department of Employment Affairs and Social Protection (DEASP) spent €19.87 billion on schemes, services and administration in 2016, a marginal decrease of 0.5 per cent compared to 2015 (€19.97 billion).
The provisional outturn on social protection in 2017 is €19.96 billion. Total expenditure on social protection is estimated at €20.01 billion for 2018. Table 1 shows social protection expenditure between 2008 and 2016 in absolute terms and as a share of Modified Gross National Income (GNI*).
Table 1 – Social Protection Expenditure, 2008 – 2016
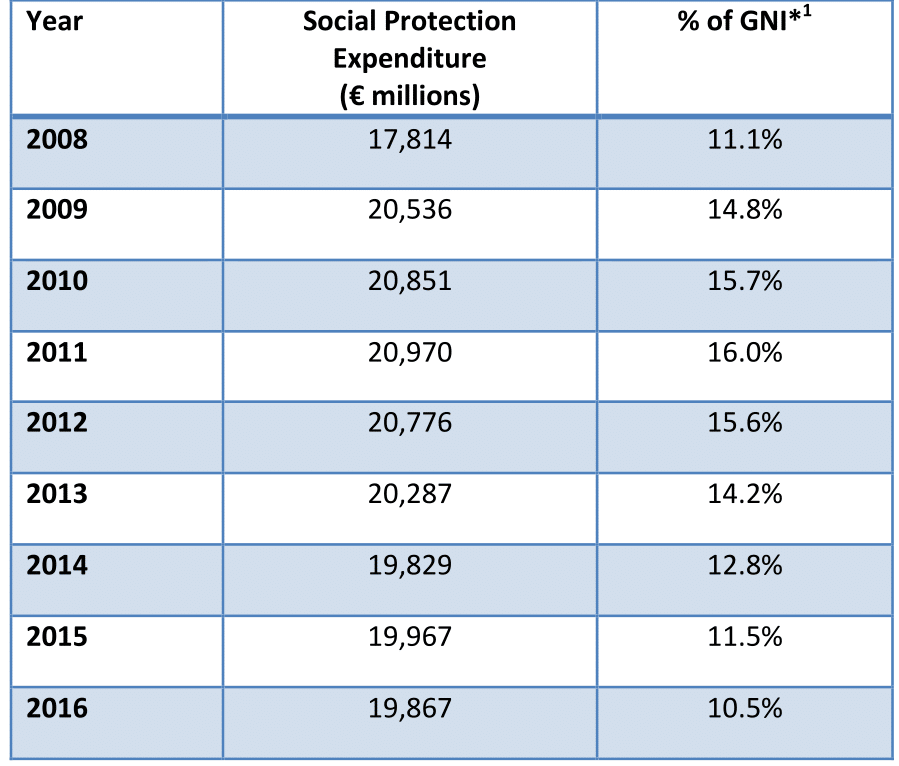
(Sources: DEASP, 2017 and CSO, National Accounts)
The total number of recipients of weekly social protection payments in 2016 was 1.39 million. This represents an increase of 1.2 per cent (16,624) relative to 2015. When qualified adults and children are included, there were 2.1 million beneficiaries in 2016 (a decrease of 0.5% or 11,320) – 44.1 per cent of the population were beneficiaries of social payments in 2016. The downward trend in unemployment-related expenditure reflects the decline in recipient numbers of working age employment and income support payments. Almost €4 billion was spent on Working Age Income Supports in 2016; a decrease of 11.7 per cent on the previous year. The seasonally adjusted unemployment rate in December 2017 was 6.2% (146,700 people). The rate was 7.5% (173,600) a year previously.
Payments by Group
Social Protection payments go to three main groups of people (or programmes); children, people of working age, and retired and older people. Full details on all schemes may be accessed here in the report. Table 2 shows the expenditure amounts in 2016 on these three cohorts relative to 2015.
Table 2 – Programme Expenditure in 2015 and 2016, € millions
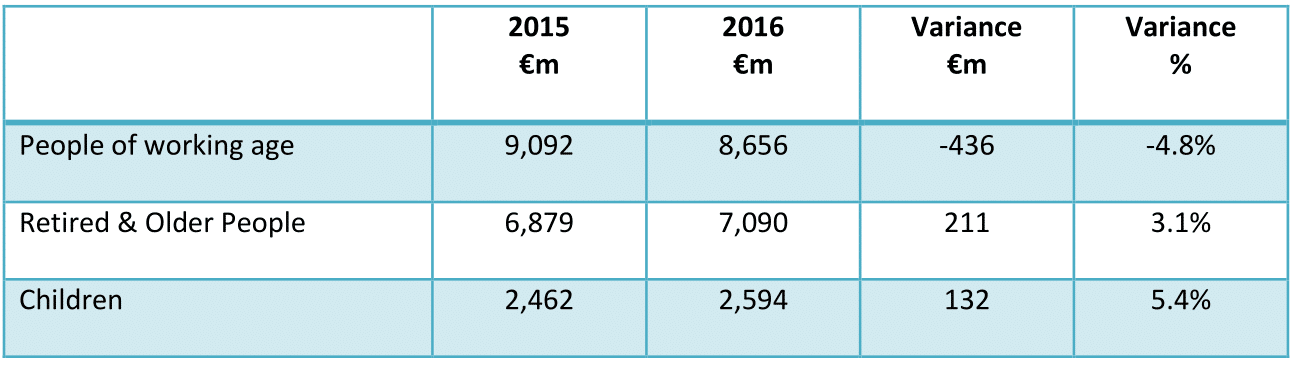
(Source: DEASP, 2017)
The largest proportion of expenditure (45%) goes towards people of working age. This programme received €8.7 billion in 2016. Retired and older people are the second largest group in expenditure terms, with €7.1 billion being spent in 2016 (36.9%). Spending on children amounted to €2.6 billion (13.5%). Supplementary payments worth €879m accounted for 4.6 per cent of expenditure2.
Table 3 shows the total expenditure and the number of recipients by programme in 2016 (latest year available).
Table 3 – Total Recipients and Expenditure by Programme, 2015 – 2016
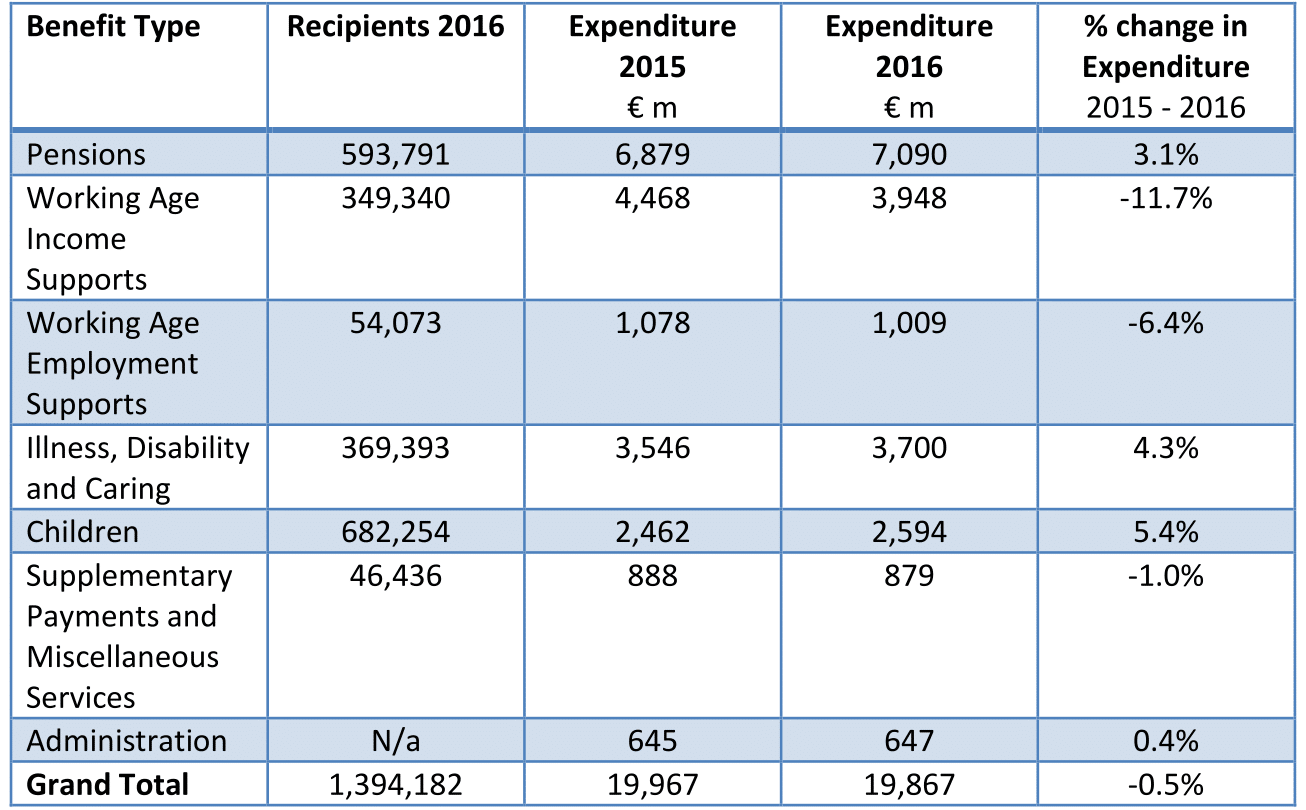
(Source: DEASP, 2017)
Read the full Social Benefits report here.
___________________________
Notes:
1 Modified GNI (GNI*) is a new indicator that was recommended by the Economic Statistics Review Group and is designed to exclude globalisation effects that are disproportionately impacting the measurement of the size of the Irish economy.
2 Administration spending of €644.6 million is excluded from this comparison.
About author
Related Articles
-
-

Ireland’s Pension System Assessed
6 Nov 2017 -
Where Have The Extra Jobs Been Created?
4 Oct 2017 -

Social Protection – Expenditure Trends
28 Aug 2017
79 Merrion Square, Dublin 2, Ireland
tel: 353 (1) 676 0414 | email: info@publicpolicy.ie
Company registration number: 504956
Privacy Policy | Chairman's Blog | Events | Video | Public Policy Documents | News Property Tax Ireland | Pension Reform Ireland | Water Charges Ireland