


Large Increase In Homelessness
15 Nov 2017Key Point
There were over 8,300 homeless people in September 2017 – an increase of almost 1,700 or over 25 per cent since September 2016.
Homeless Persons
Table 1 shows the number of homeless across the country in September 2017.
Table 1 – Homeless persons by region, No. and % Share
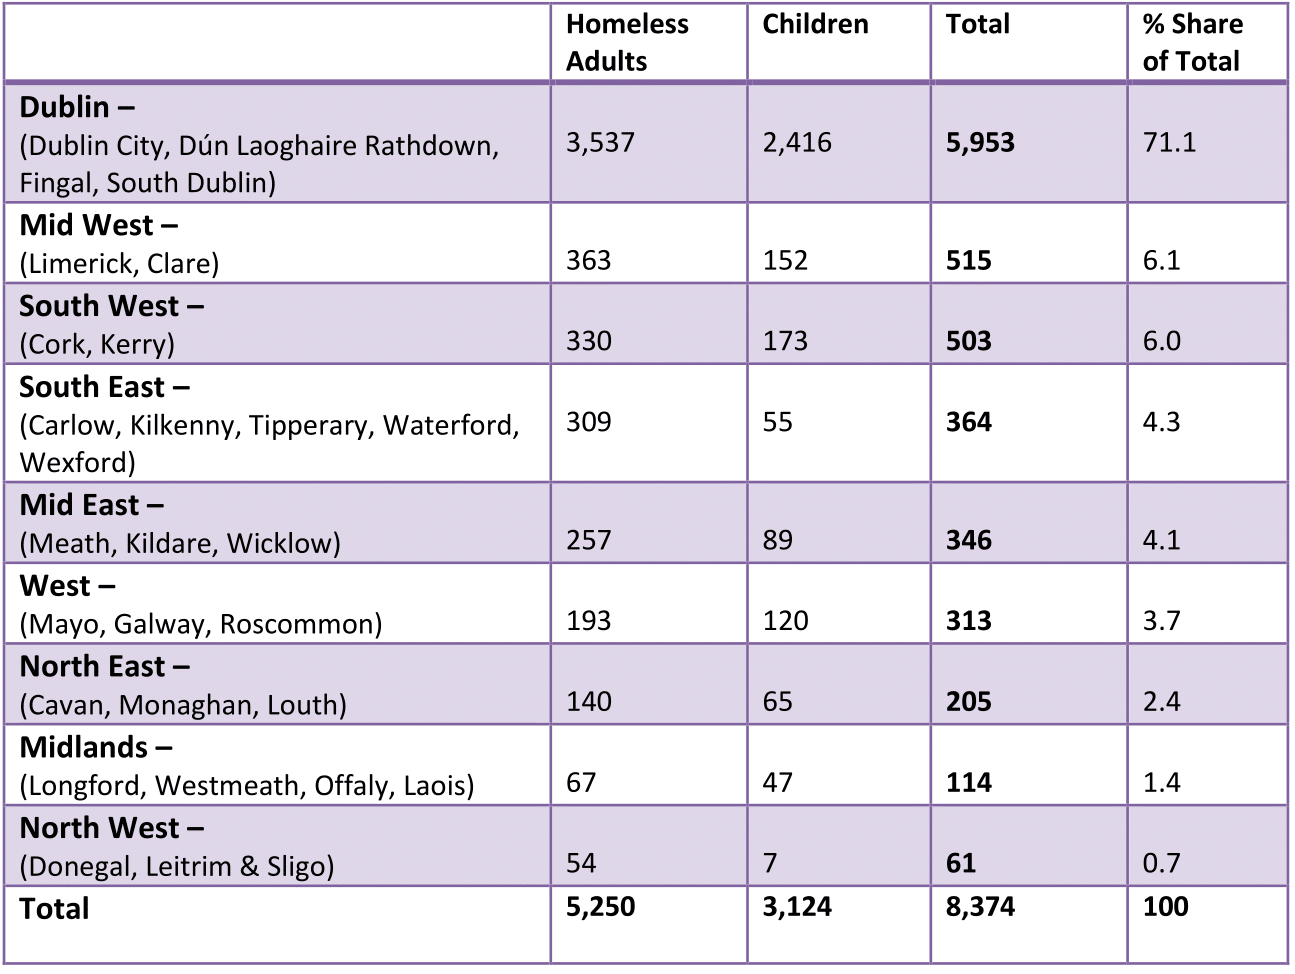
(Source: Department of Housing, 2017)
Key Figures:
- Dublin had 5,953 homeless people in September 2017 – seven-in-ten of the total across the country (71% of total).
- Two-in-five homeless in Dublin are children (2,416). The Midlands has the highest share of homeless children (41.2%), followed by Dublin (40.6%) and the West (38.3%).
- The second highest share of homeless persons is found in the Mid-West (Limerick and Clare) with 515 persons (6.1% of total homeless), followed by the South-West (Cork and Kerry) with 503 persons (6% of total homeless).
Homeless Accommodation
The accommodation types utilised by homeless persons in September 2017 are shown in figure 1.
Figure 1 – Homeless Accommodation by Category, % Share
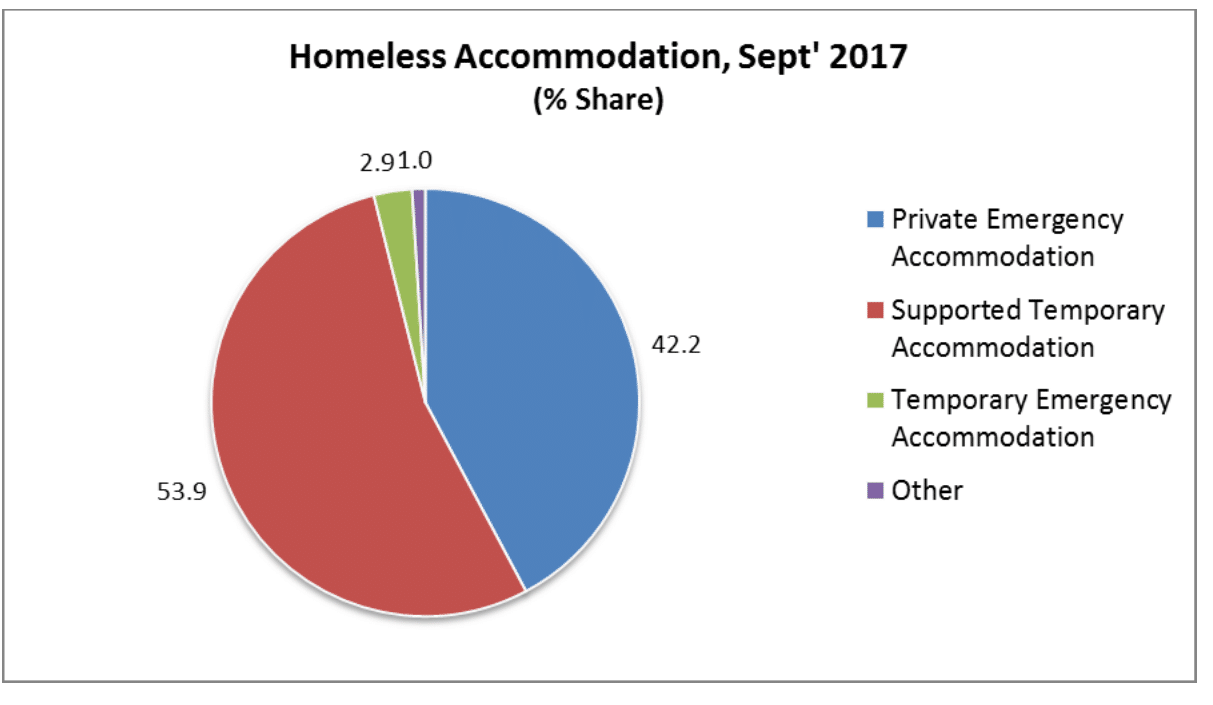
(Source: Department of Housing, 2017)
As shown in figure 1, the majority of homeless persons (53.9%) are utilising supported temporary accommodation (STA). This accommodation provides onsite professional support to homeless people. Approximately two-in-five (42.2%) are being supported in private emergency accommodation (PEA) – this includes hotels, B&Bs and other residential facilities. A much smaller share of homeless persons (2.9%) use temporary emergency accommodation (TEA)1 , while 1% use other services.
Spending on Homelessness Continues to Increase
The financial cost of homelessness was just under €119 million in 2016. The 2017 expenditure estimate for homelessness services is over €140 million. This is an increase of €21.5 million relative to last year, or an increase of 18 per cent.
Table 2 shows expenditure across five categories of homeless services as reported by local authorities from January to June 2017 (H1 2017), and projected expenditure for the full year.
Table 2 – Spending on Homelessness by Category, January – June 2017
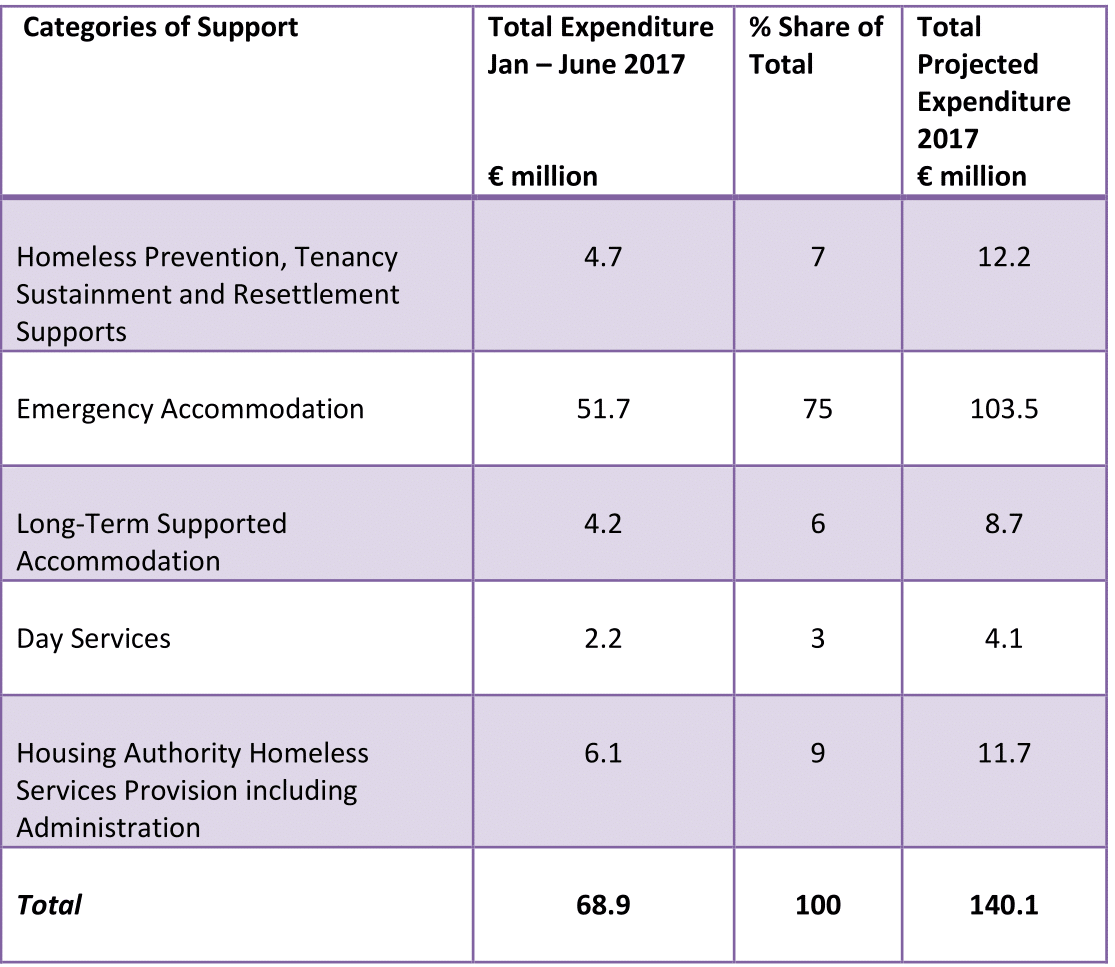
(Source: Department of Housing, 2017)
Table 2 shows that over €51 million was spent on emergency accommodation in H1 of 2017. This is equivalent to three-quarters of total homeless service expenditure in the first six months of 2017. Dublin accounts for 87 per cent or €44.7m of this emergency accommodation cost.
While four of the spending categories have spent circa half of their 2017 funds, the category of ‘homeless prevention, tenancy sustainment and resettlement supports’ has spent 39 per cent of its €12.2 million allocation. Over €140 million is expected to be spent on homeless services in 2017. Dublin will spend €116m or 83 per cent of the total where seven-in-ten homeless persons live.
___________________________________
Notes:
1 Temporary Emergency Accommodation: emergency accommodation with no (or minimal) support.
About author
Related Articles
-
-
Where Have The Extra Jobs Been Created?
4 Oct 2017 -

Homelessness
6 Sep 2017 -

Social Housing Need In Dublin
22 Mar 2017
79 Merrion Square, Dublin 2, Ireland
tel: 353 (1) 676 0414 | email: info@publicpolicy.ie
Company registration number: 504956
Privacy Policy | Chairman's Blog | Events | Video | Public Policy Documents | News Property Tax Ireland | Pension Reform Ireland | Water Charges Ireland