


The Cost Of Health Care Rises Substantially As People Get Older
4 Feb 2016Key Point
The high cost of health insurance claims by the older age groups shows the challenges that will arise in the future in funding our health services as the population ages.
Introduction
In 2014, over two million people in Ireland had private health insurance. Forty-four percent of the population were covered by either open enrolment or restricted undertakings schemes1 . Restricted membership undertakings include those providing insurance cover for An Garda Síochána, ESB and Prison Officers. They have accounted for approximately four percent of the market since 2005. This note considers the cost of claims paid per insured life of those with open membership insurance.
Age Structure
The age profiles of those with health insurance are broken down into eight different groups in table 1. This table shows those who have open membership insurance between 2011 and 20142 .
Table 1
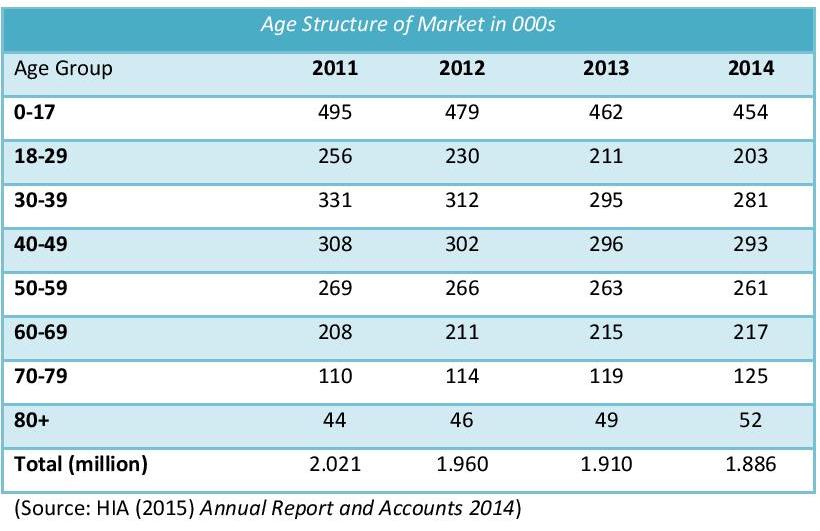
The number of people with open membership insurance has decreased by seven percent between 2011 and 2014. While the number of people insured in age groups 0 to 59 has decreased on average by 10 percent, those aged between 60 and 80+ have increased on average by twelve percent, reflecting demographic trends. As of 1 July 2015, 1.9 million people had private health insurance and a further 98,927 were serving initial waiting periods. The number of insured persons increased in the twelve months from July 2014 to June 2015 by 2.7%. Figure 1 shows the percentage share of open membership of those covered by age group in 2014.
Figure 1
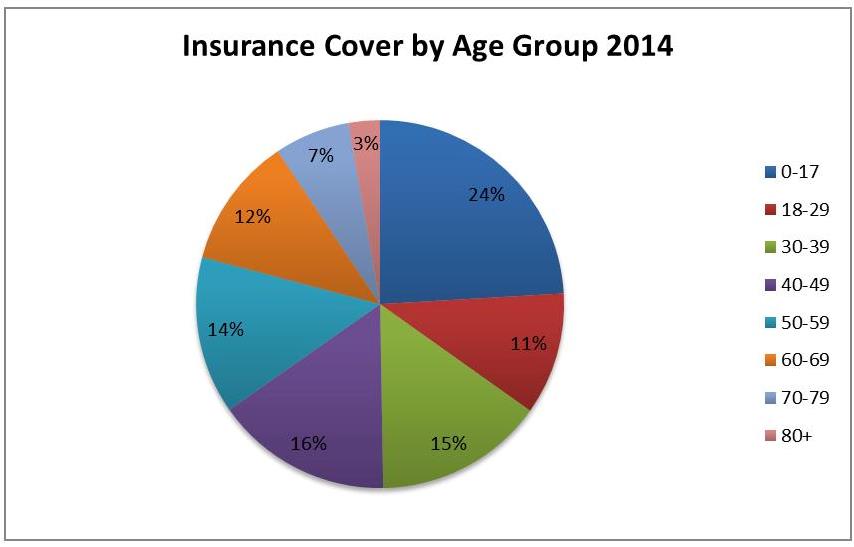
(Source: HIA (2015) Annual Report and Accounts 2014)
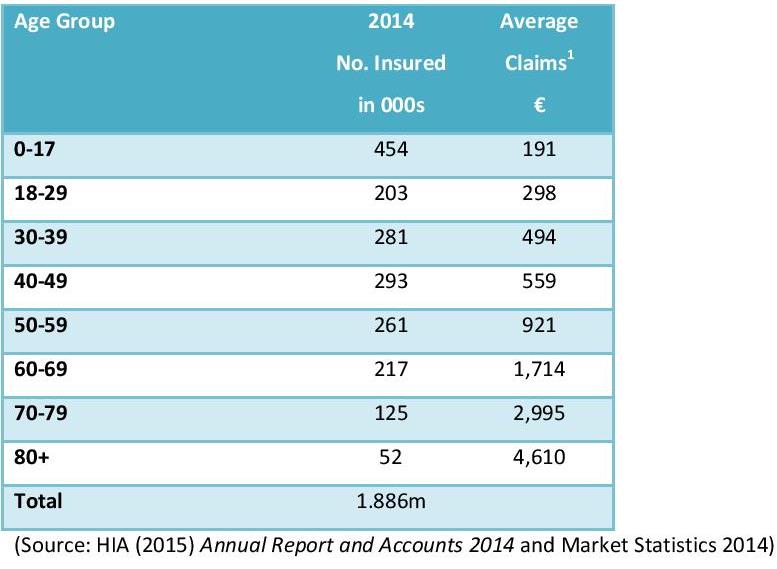
The value of claims paid per insured life on open membership undertakings in 2014 is shown in table 2. Those aged 80+ had the highest cost of claims. Indeed those aged 80+ claimed over twenty times that of those aged up to 17 years, and more than two and half times that of those aged 60 – 69 years.
Table 2
Claim Variation by Age
Table 3 shows the average cost of claims by age group between 2004 and 2014. The cost of claims by each age group has increased. However, the greatest increase in the cost of claims paid has been amongst those aged 80+ which has increased by 154 percent. It has also been the age group between 2010 and 2014 which has seen the largest increase in claims paid. During this period the percentage increase in claims paid ranged between 18% (aged 50-59) and 51% (aged 80+). The average increase was 28 percent between 2010 and 2014.
Table 3 – Value of Claims Paid €, by Age Group and Year
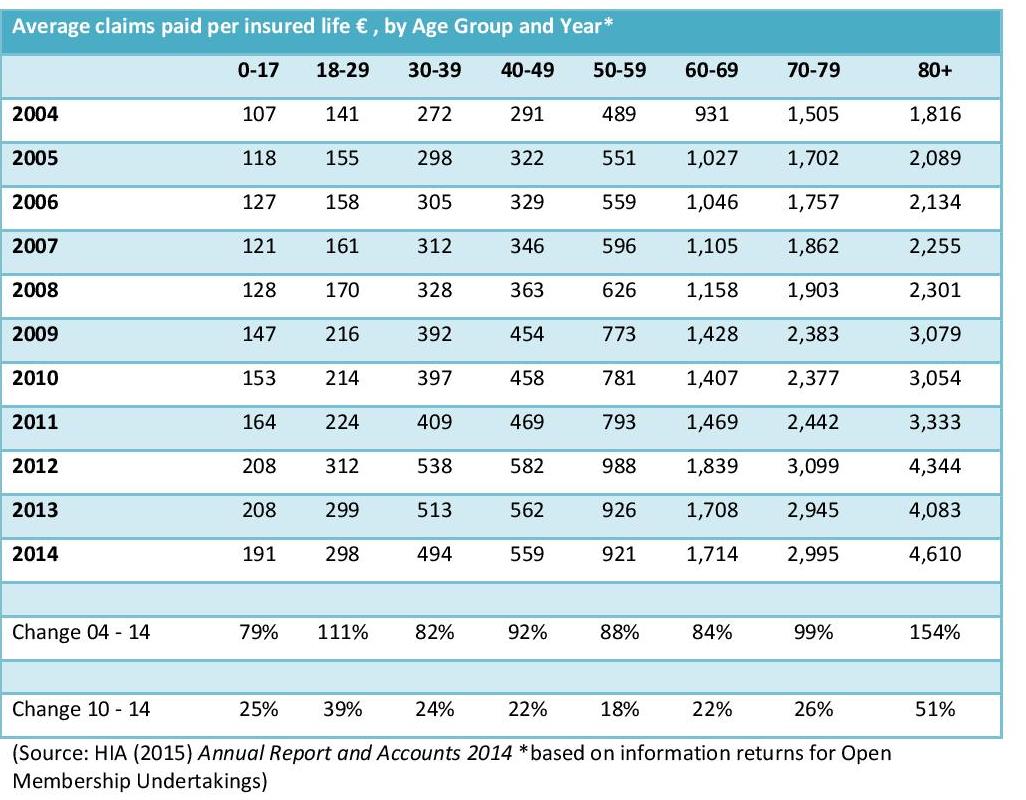
Figure 2 groups the data in the above table into three age categories to show the widening gap between claims paid for different age cohorts.
Figure 2 – Claims Paid per Insured Life €, by Age Group and Year
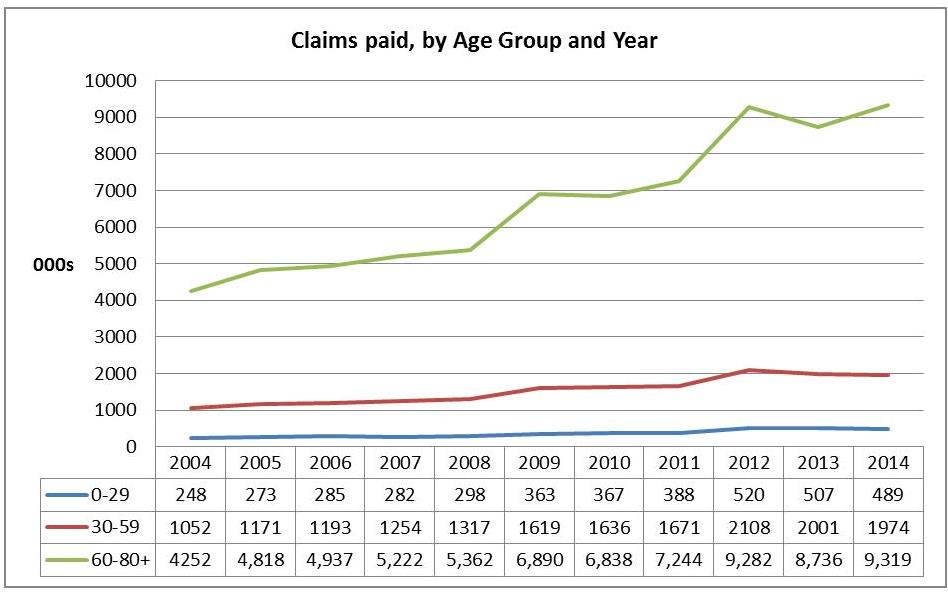
(Source: HIA (2015) Annual Report and Accounts 2014)
Claims costs for those aged 0 – 29 years have increased by 97 percent between 2004 and 2014. Similarly, for those aged 30 – 59 years by 88 percent. The largest increase has been amongst those aged 60 – 80+ years by 119 percent, from an average in 2004 of €4,252 to €9,319 in 2014. However, the costs decreased for this age cohort by 6 percent in 2013 over 2012, before rising by 6.7 percent in 2013. Between 2012 and 2014, those aged 0-29 and 30-59 years saw their claims reduce by the 6 percent.
The average cost of claims per person has increased more than one-hundred percent (111%) from 2004 to 2014. The only year which noted a decline was 2013 when the cost of average claims decreased by 2.2 percent. The average percentage increase over the period is 8 percent. However, larger than average increases occurred in 2005 (13%), 2009 (28%), and 2012 (14%).
Conclusion
The high cost of health insurance claims by the older age groups shows the challenges that will arise in the future in funding our health services as the population ages.
Notes:
1 As of June 2015, 46 percent of the Irish population are estimated to have private health insurance (including restricted undertakings) according to the Health Insurance Authority.
2 The table excludes those who are serving initial waiting periods, people insured with restricted membership undertakings and people who are insured with products that are not subject to the health insurance stamp duty and the age related health credits.
3 Average claims represents the total claims paid in each age group divided by the number of insured people in that age group (including those who made no claims).
Tagged with:
Health
About author
Related Articles
-
-

Why Are So Many People In Hospital In Ireland ?
23 Feb 2017 -

Health Costs By Age Group
9 Nov 2016 -

HSE Agency Costs Are 50% Over Budget In 2016
5 Oct 2016
79 Merrion Square, Dublin 2, Ireland
tel: 353 (1) 676 0414 | email: info@publicpolicy.ie
Company registration number: 504956
Privacy Policy | Chairman's Blog | Events | Video | Public Policy Documents | News Property Tax Ireland | Pension Reform Ireland | Water Charges Ireland