


Early Childhood Education in Ireland
19 Jul 2013Key Point
Returns to early childhood education are high. Ireland spends significantly less than other developed countries.
Introduction
This report compares the provision of early childhood education in Ireland to other developed countries. According to the OECD1 , early childhood education must fulfil four criteria. It must be school-based education provided for children at least three years old, but not older than six. Such programmes must be designed specifically to meet both educational and developmental needs of children, and be undertaken by staff qualified in this form of education specifically.
The Free Pre-School Year2 programme was introduced in 2010, providing a school year of education beginning earliest at age three3 . As of this date, 63,000 pupils are annually provided early childhood education under this scheme, at an estimated cost of €166m. A 2005 National Economic and Social Forum study estimates that on average over €7 of returns are achieved for every €1 invested in early childhood education4 .
The Economics of Early Childhood Education
In order to provide context to this report, this section provides a brief summary of the discussion over the importance of early childhood education. It outlines the evidence of early education returns for individuals specifically before extending this argument to discuss its wider social benefits. Melhulsh et al. (2008)5 attempted to quantify the impact of early childhood education relative to primary school returns. This study uses a sample of English and mathematics test scores for eleven year old pupils in England, taking into account the variations in socioeconomic background of each student. It estimates that the average benefits derived from six years of primary school education is equivalent to just eighteen months of high quality pre-school education.
Cunha et al. (2006)6 provide an extensive summary of the benefits of early childhood education, arguing that the rate of return from investment in human capital is greatest during pre-school years. Figure One outlines the economic justification for early childhood investment for a typical student. It assumes that the sum invested in education is constant across all ages.
Figure One: Returns to Education Investment
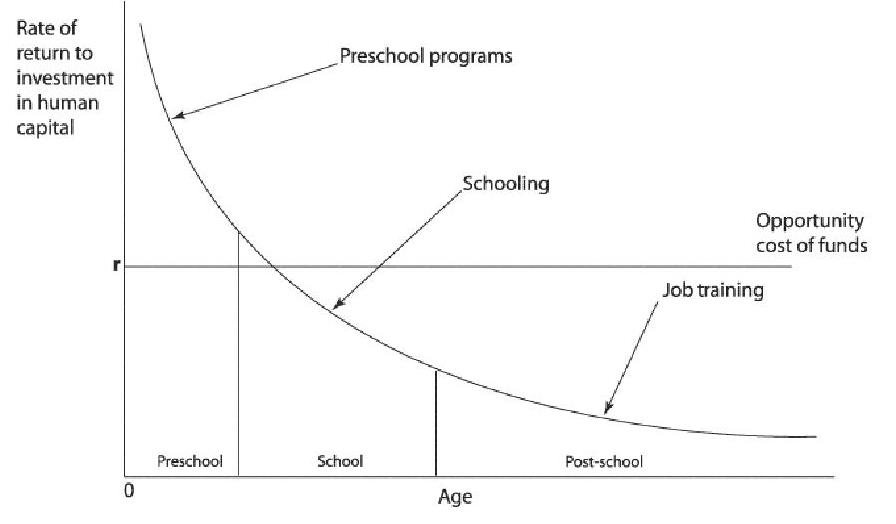
Figure One: Cuhna et al. (2006), rates of return to human capital investment, initially setting investment to be equal across all ages.
Learning functions exhibit diminishing returns to scale; the social benefits of investing in preschool education exceed equivalent returns in later life. Regardless of the intrinsic ability of a given pupil, the allocation of educational investment is most efficient at an earlier age. The authors suggest that opportunities missed by under-provision of early childhood education form greater economic costs. The investment necessary to allow an individual to converge to the level they would otherwise exhibit with this form of education increases with age. Cunha et al. suggest such costs are often “prohibitively”, and thus those students denied access to early education cannot fulfil their original levels of potential.
This suggests that exposure to such forms of education augments both cognitive and non-cognitive skills. Concerning the cognitive gains, academic consensus suggests that access to early education accelerates the ability of pupils to form intellectual skills throughout future childhood and adolescence. As Heckman (2000)7 summarises, “early learning begets later learning”; children require an initial framework of literacy and numeracy provided by early education to extend upon in the future. The differences in educational attainment between groups that receive early childhood education and those who do not are perpetuated across time. Non-cognitive benefits may also be discussed. In circumstances where early childhood education may not directly boost the Intelligence Quotient score of a pupil, important emotional and social skills are developed. Cleveland & Krashinsky (2003)8 argue these non-cognitive skills derive long term benefits. They are argued to assist school-readiness and future employment outcomes, and are associated with better behavioural consequences. Further, as Lave and Wenger (1992)9 summarise, exposure to the diverse schooling environment at this early age provides the “optimal environment for children’s cognitive, emotional and social growth”.
Funding of Early Childhood Education
This section discusses how early childhood education is funded in Ireland. To provide context to this particular form of education, Figure Two shows education spending as a percentage of Gross National Income for a sample of seventeen European Union countries. These values are for the year 2010.
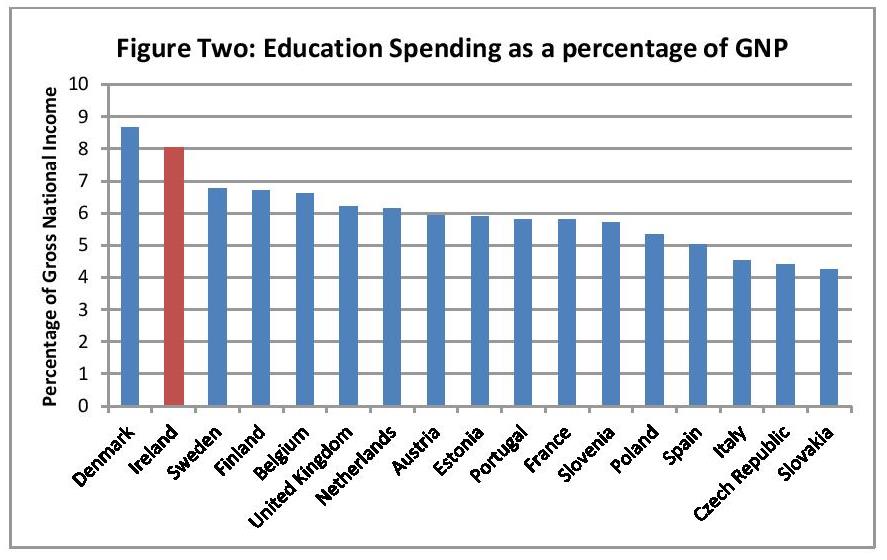
Source: OECD10
It shows that overall education spending is proportionately second highest in Ireland, approximately 8% of Gross National Income. This value is 2.14% greater than the sample average. Furthermore, the sum of annual expenditure per student in Ireland exceeded both European Union and OECD averages across primary, secondary and tertiary forms in 201011 . This measure accounts for purchasing power parity, considering the cost of education spending relative to how expensive other goods are.
Figure Three provides the values of total early childhood education spending as a proportion of overall education spending across a sample of eighteen European Union countries.
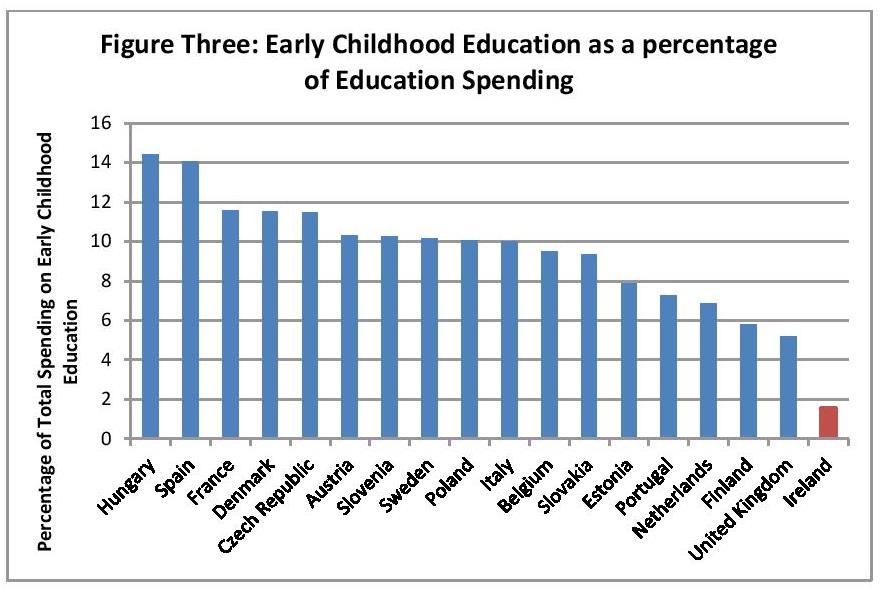
Source: OECD12
It shows that taking into account the relatively high overall education spending in Ireland does not alter the conclusion. Early childhood education accounts for approximately 1.57% of overall education spending, the lowest within the sample. This value is over nine times lower than Hungary, where approximately 14.41% of education spending is allocated towards early childhood programmes. Comparing Ireland to the second lowest level of relative expenditure within the sample, the United Kingdom allocates over three times as much of the pool of education spending towards early childhood.
Whereas total education spending allocated to early childhood is shown to be lower in Ireland than across other European Union countries, this relative measure does not mediate for the observation that overall education spending within Ireland is high. Combining these two measures will provide insight into the absolute levels of early childhood spending, to supplement the relative values above. Figure Four provides the values of total early childhood education spending as a proportion of overall Gross National Income across this European Union sample for the year 2010.
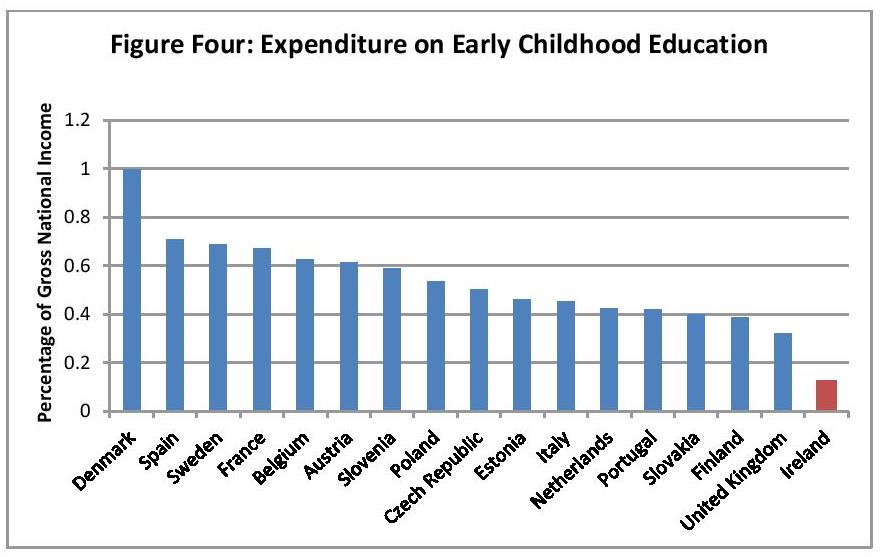
Source: OECD13
As a percentage of Gross National Income, Irish spending on early childhood education remains lowest in the sample. At 0.13%, it is almost eight times lower than that of Denmark. The second lowest level of expenditure on early childhood education in the sample, the United Kingdom, is proportionately over two and a half times that of Ireland. To form a conclusion based upon these findings, we may bear in mind the above-average per pupil spending with respect to both the European Union and OECD in later forms of education. Hence, this evidence suggests that Ireland places a lesser weighting of importance on early childhood education than is observed internationally.
Student to Teacher Ratio
Figure Five outlines the student to teaching staff ratio in early childhood education, comparing Ireland to sixteen other European Union countries for the year 2010. It is important to note that teachers are defined as the cumulative sum of both professional staff and teacher aids.
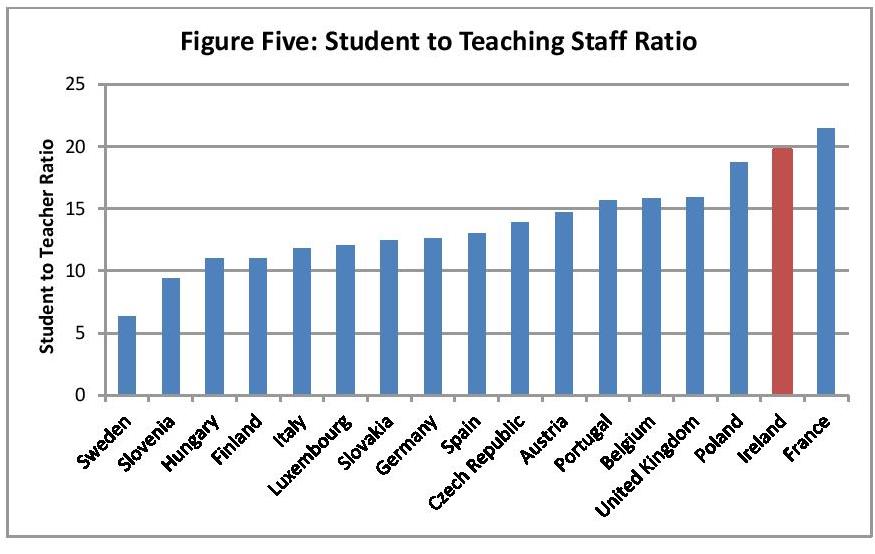
Source: OECD14
It shows that the ratio in Ireland, of 19.8 students to every teaching staff member, is the second largest within the sample. There are approximately 5.4 more students per teaching staff member in Irish early childhood education programmes than the OECD average. Smaller class sizes, to an extent encapsulated by the student-to-teacher ratio, are often associated with better educational outcomes15 . Thus we may consider this measure to approximate learning quality. However, this figure excludes other relevant factors, such as the length of the teaching day or amount of instruction time.
Enrolment Rates
A further measure that may be used to compare Irish spending internationally is the enrolment rate of students into both early childhood and Primary education at age four. Figure Six compares enrolment rates of three and four year olds into early childhood education programmes in Ireland to nineteen other European Union countries in 2011. Countries are listed in order of age four enrolment rates. It should be noted that formal education enrolment is excluded from this measure, although this does not apply to any of the countries within this sample.
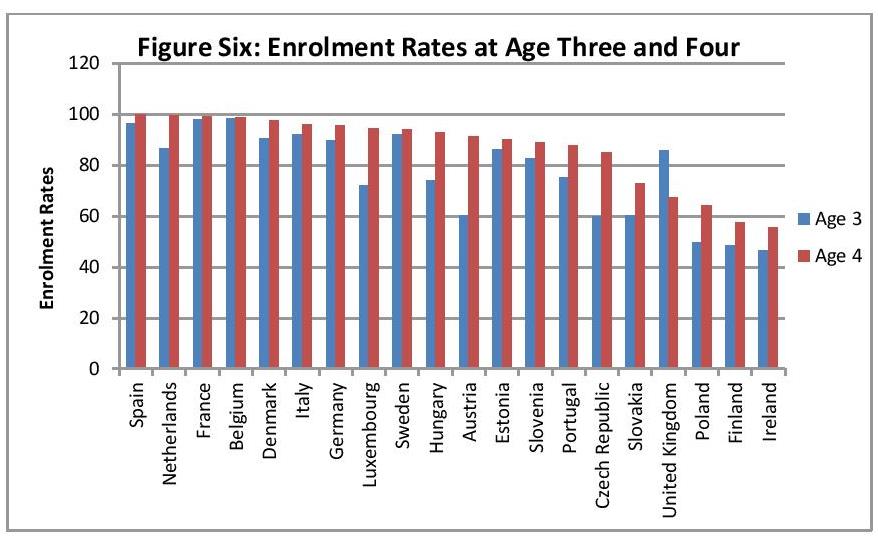
Source: OECD16
It shows that enrolment rates at both ages three and four, 47% and 56% respectively, are lowest in Ireland. Ireland is only one of four countries below European Union and OECD country averages in both age groups.
In addition to overall enrolment rates, a comparison concerning the breakdown between public and private sectors may be investigated. Figure Seven below charts the proportion of students enrolled in public educational programmes with respect to total early childhood education for a sample of twenty European Union countries in the year 2011.
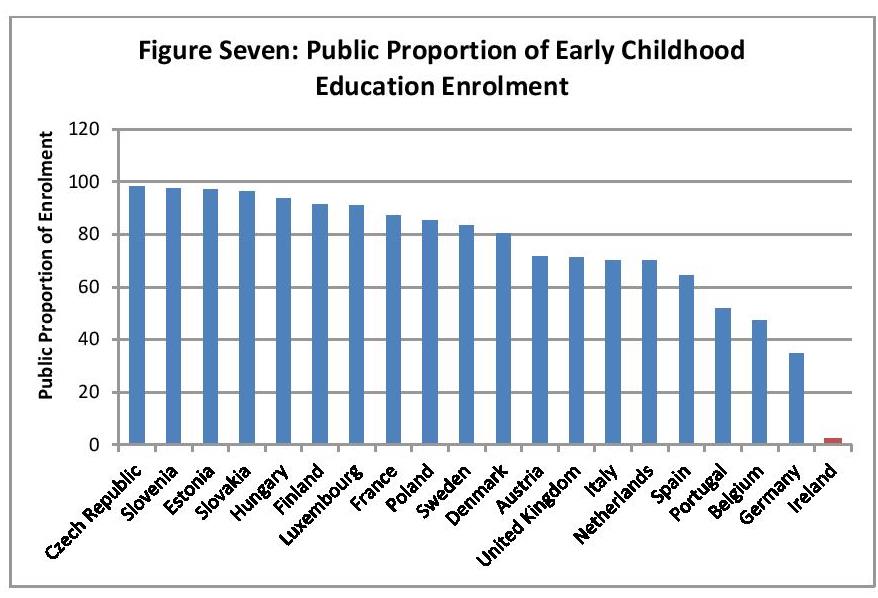
Source: OECD17
Of those engaged in early childhood education, Ireland is shown to have the lowest proportion of publicly educated students. At 2.2%, it is 72% and 65.7% below the European Union and OECD averages respectively. This value implies that, for every child attending a public early childhood education programme in Ireland, nearly forty-six attend private equivalents. This figure may be further compared to Germany, the country exhibiting the second lowest proportion within the sample. Of the population of children receiving this form of education, the likelihood that a randomly drawn student is within a public programme in Germany is almost sixteen times greater than in Ireland.
Notes:
1 OECD Education at a Glance 2012, Definitions and methodologies
2 Oireachtas Library & Research Service, Early Childhood Education and Care (No. 4, 2012).
3 Children aged between 3 years 2 months and 4 years 7 months on 1st September of the school year participated in.
4 National Economic & Social Council Report 31, Early Childhood Care and Education (July 2005).
5 Melhuish et al. (2008), Effects of the home learning environment and preschool centre experience upon literacy and numeracy development in early primary school, Journal of Social Issues.
6 Cunha et al. (2006), Interpreting the evidence on life cycle skill formation, Handbook of the Economics of Education.
7 Heckman (2000), Invest in the Very Young, Ounce of Prevention Fund.
8 Cleveland & Krashinsky (2003), Financing ECEC services in OECD countries, OECD Early Childhood Education and Care workshop (Rotterdam).
9 Lave & Wenger (1992), Situated learning: Legitimate peripheral participation, Cambridge University Press.
10 OECD Education at a Glance 2013; Tables B4.1. and B4.2. Figures adjusted using Eurostat 2010 Q1 Gross National Income values.
11 OECD Education at a Glance 2013; Table B1.2.
12 OECD Education at a Glance 2013, figures calculated by combining Table B4.1., B4.2. and C2.2
13 OECD Education at a Glance 2013, Table C2.2. Figures adjusted using Eurostat 2010 Q1 Gross National Income values
14 OECD Education at a Glance 2012, Table C2.2
15 For further discussion and evidence see: Hanushek (2002), Evidence, politics and the class size debate, The class size debate; Graue et al. (2007), The wisdom of class size reduction, American Educational Research Journal.
16 OECD Education at a Glance 2013, Table C2.1
17 OECD Education at a Glance 2013, Table C2.2.
 .
.
Tagged with:
Education
About author
Related Articles
-
-

Education – Pupil Enrolment Projections
17 Jan 2017 -

Better Educated People Enjoy Better Health
4 May 2016 -

Public Spending on Health and Education
20 Apr 2016
79 Merrion Square, Dublin 2, Ireland
tel: 353 (1) 676 0414 | email: info@publicpolicy.ie
Company registration number: 504956
Privacy Policy | Chairman's Blog | Events | Video | Public Policy Documents | News Property Tax Ireland | Pension Reform Ireland | Water Charges Ireland