

Local Authorities 2008 – 2015
17 May 2017Key Point
The local government sector has reduced significantly since 2008 due to the transfer of services for water, waste collection and third level grants to other agencies. Staff numbers fell by over 8,300 or 24 per cent over the period from 2008 to 2015.
Local Authority Income
Local authorities receive their income from a range of sources; commercial rates, Local Property Tax (LPT), grants from central government, and charges for services they provide. Local authority revenue income by source in 2008 and 2015 is shown in Table 1 below.
Table 1
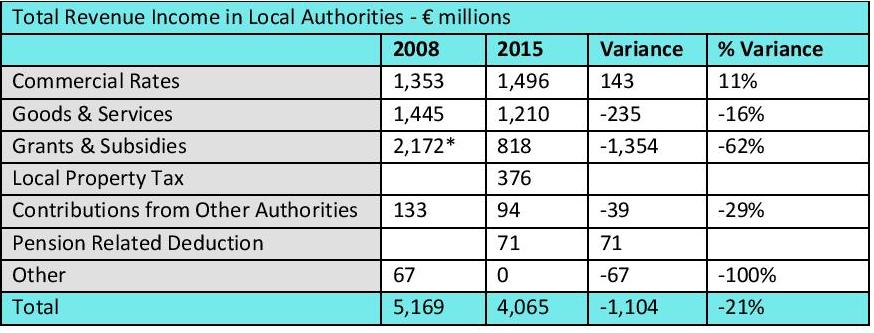
(Source: Annual Financial Statements, and Oireachtas.ie *including General Purpose Grant)
Note: ‘Contributions from other authorities’ represent income received when a local authority incurs costs on behalf of a number of local authorities. For example, fire services in Dublin are provided by Dublin City Council and the other three Councils contribute towards the costs incurred each year. This income has decreased by 29% or €39m between 2008 and 2015.
Table 1 shows that the income of local authorities has declined by €1.1 billion in the period 2008 – 2015. However, the range of services provided by local authorities has reduced. Water services have been transferred to Irish Water since January 2014, third level student support grants are now the responsibility of Student Universal Support Ireland (SUSI) and domestic waste collection has been outsourced.
We now analyse the effect of these in turn.
Water Services
Irish Water has a Service Level Agreement (SLA) with local authorities. The SLA between them is an outsourcing agreement for up to a twelve year period. The cost of payroll and overheads under the SLA in 2015 was €253m.
In 2008, programme group three (water supply and sewerage) received €274m in income. In 2015, income paid to local authorities from Irish Water is classified as income from goods and services. This amounted to €323.3m in 2015 (8% of total income). The net effect is to increase local authority income in respect of water services by approximately €49.4m or 18%.
Third Level Student Grants
Prior to the establishment of Student Universal Support Ireland (SUSI) in 2012, further and higher education grants were administered by 66 agencies – 33 local authorities and 33 Vocational Education Committees (VECs)1 . In 2008, €263.6m was provided in ‘student support and related expenses’ by local authorities and VECs. The amount of grants provided through SUSI in 2015 was €410.8m 2 .
Waste Collection
Table 2 shows revenue collected through waste collection from 2008 to 2015.
Table 2 – Waste Collection Income of Local Authorities, 2008 – 2015
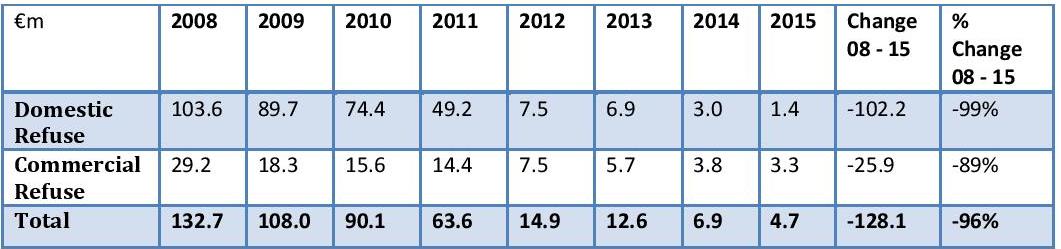
(Source: Amalgamated Annual Financial Statements)
Expenditure on these services in 2008 was €670 million. As a result expenditure on continuing services by local authorities has declined by €434 million or almost 10 per cent.
Staff Numbers
The reduced size of the local government sector is also reflected in a reduction of 24 per cent in staff numbers. Table 3 shows that local authority staff accounted for more than one third of the reduction in public service staff between 2008 and 2015.
Table 3 – Public Service WTEs, Q4 2008 and 2015
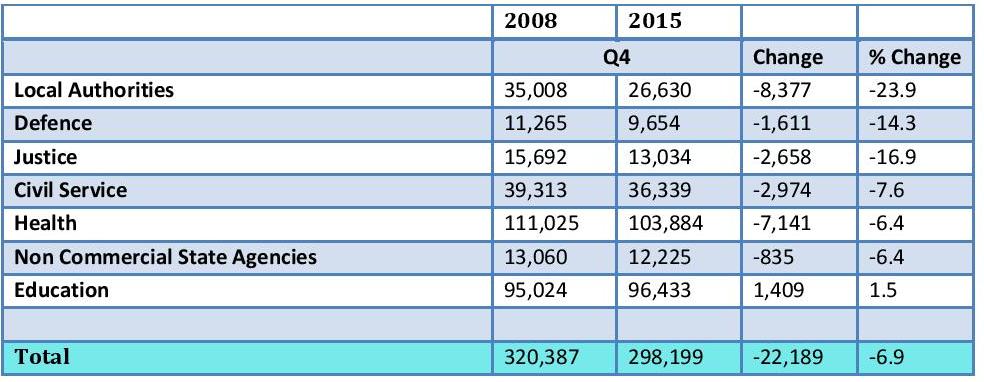
(Source: DPER (2017), Databank and Public Service Pay Commission (2017))
Table 4 highlights the change in employment numbers across the 31 local authorities from Q4 2008 to 2015. It shows that Sligo County Council had the highest percentage decrease in whole time equivalent (WTE) staff numbers with a reduction of one third (33.5% or 196 WTEs). The lowest percentage decrease was in Westmeath County Council; 14% or 75 WTEs.
Table 4 – Local authorities’ WTEs, Q4 2008 and 2015
[table id=58 /]
(Source: DPER (2017), Databank)
Payroll expenses in the form of salaries and wages in local authorities have decreased by circa €444m (25.7%) between 2008 and 2015; from €1.73bn to €1.28bn respectively.
In the year to Q4 2016, 21 local authorities increased their number of WTEs, while 10 decreased. The net impact was an increase of 232 (0.9%) in local authority WTEs to 26,862 in the year to Q4 20163 .
______________________________________
Notes:
1 Comptroller and Auditor General (2015), ‘Special Report on Restructuring the Administration of Student Grants’
2 Department of Public Expenditure and Reform (2017), DPER Databank
3 This figure includes 7 WTEs in Regional Assemblies and 1 WTE in the Commission for Energy Regulation (Water Sector).
About author
Related Articles
-
-

Local Authority Rent Arrears
25 Oct 2017 -

Local Property Tax Variations – 2018
12 Oct 2017 -

Local Authority Accounts 2016
26 Jul 2017
79 Merrion Square, Dublin 2, Ireland
tel: 353 (1) 676 0414 | email: info@publicpolicy.ie
Company registration number: 504956
Privacy Policy | Chairman's Blog | Events | Video | Public Policy Documents | News Property Tax Ireland | Pension Reform Ireland | Water Charges Ireland