
.PNG&filetimestamp=20120105113223#file)

The Irish Tax System in an International Context
7 Nov 2013Introduction
This paper gives an overview of the evolution of the Irish tax system and the changing composition of tax revenue. It also compares the Irish tax system with EU and OECD standards.
Evolution of the Irish Tax Burden
The Irish tax system has undergone significant changes over the past decade – from boom, to crisis, to recovery. At the height of the boom, government revenue was heavily reliant on income generated as a result of the housing bubble; house prices had risen fourfold over the period from 1997-2007, which spurred on vast growth in construction activity. Subsequently, property-related revenues included not only the large revenue stream associated with stamp duty and capital gains tax; but also, and just as importantly, the significant amounts of VAT paid by the property developers, and the substantial income tax paid by the workers in the construction sector and other sectors that benefited from this windfall . In addition, tax revenues from levied on these booming activities were used to finance tax cuts elsewhere, thus narrowing the tax base.
As a result, when the property and in turn construction sectors crashed, tax revenues declined at a greater rate than the collapse in the general economy. Between 2007 and 2009 Irelands’ tax burden as a fraction of GDP fell by roughly 3%.
The response of the government to the collapse of the housing market was to introduce austerity measures to improve public finances. The fiscal consolidation programme Ireland has undertaken between 2008 and 2013 entailed measures equal to almost 18% of GDP (21.8% of GNP). One third of these measures have been based on increased revenue. Some of the specific policy changes that were implemented over this period to provide the government with a more sustainable revenue stream were:
- A health levy was put in place in 2008.
- An income levy was introduced in 2009.
- The introduction of a carbon tax in 2010.
- A Universal Social Charge (USC) was implemented in 2011 to replace both the income and health levies.
- Changes were made to social insurance contributions (PRSI).
- Changes were made to tax bands and credits to widen the tax base.
- Excise duties have been increased.
- The top rate of VAT has risen by 2%.
- Property taxation was reintroduced in 2013.
Despite these measures, in 2011 Ireland recorded one of the lowest figures of tax revenue as a percentage of GDP out of all of the countries that joined the EU before 2004 . Figure 1 below illustrates that from 2006-2011 Irelands’ tax revenue as a percentage of GDP was consistently below the EU and OECD averages. Alternatively when using GNP as the benchmark, Ireland ranked below the EU average but above the OECD average for the period 2006-2011.
Figure 1: Total Tax Revenues as a Percentage of output, 2006-2011
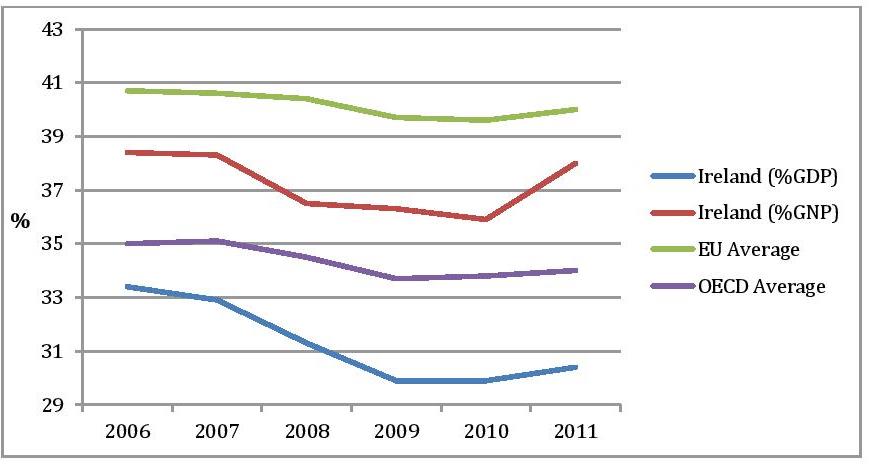
Source: Eurostat, CSO National Income and Expenditure
The Changing Composition of Tax Revenue
Tax revenue can be divided into three broad categories: indirect taxes which are taxes linked to production and imports (such as VAT and Excise Duties), direct taxes which consist of taxes on income and wealth, and social security contributions (SSC). Table 1 below illustrates how the composition of Irelands’ tax structure has changed from 2007-2012 under the three main tax categories listed above; the EU average is also given for comparative purposes. Taxes on production and imports and taxation on income and wealth fell as a percentage of output between 2007 and 2010, whereas social security contributions increased as a share of output.
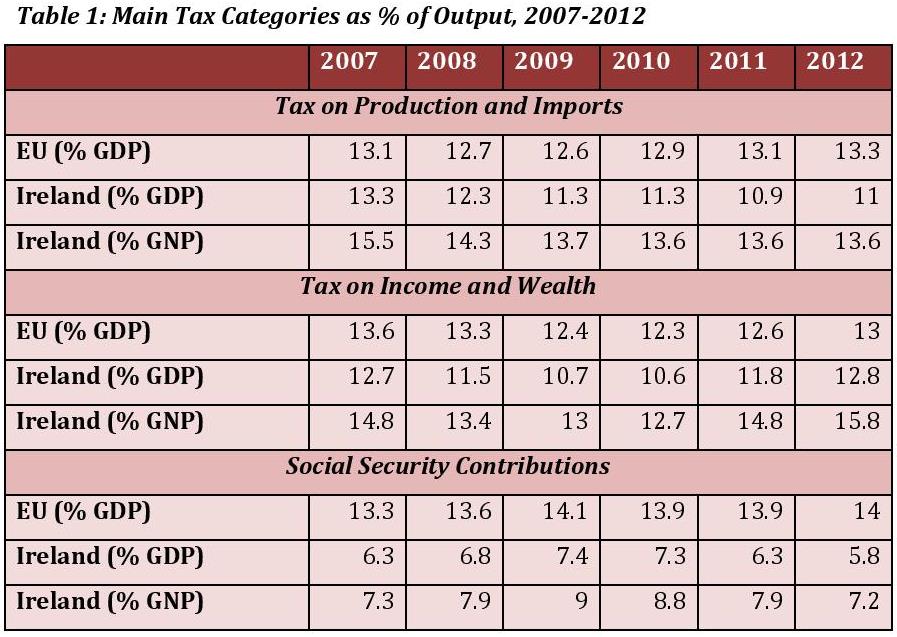
Source: Eurostat
Table 1 also demonstrates that over the period of 2007-2012 Ireland has consistently been an outlier in relation to EU norms in the area of SSC. Ireland is very similar to the EU average in the two other tax types when using GDP as the base, and when using GNP as a benchmark Irelands’ figure actually exceeds the EU average in the other two categories. In 2011 out of all the EU-27 countries, Ireland ranked tenth in terms of the burden of direct taxes, twenty-fifth for indirect taxes, and second last for SSC using GDP as a base1. Using GNP as a base, Ireland ranks sixth for direct taxes, thirteenth for indirect taxes and twenty-fifth for SSC.
Figure 2: Irish Tax Revenue as % of GNP, 2007-2012
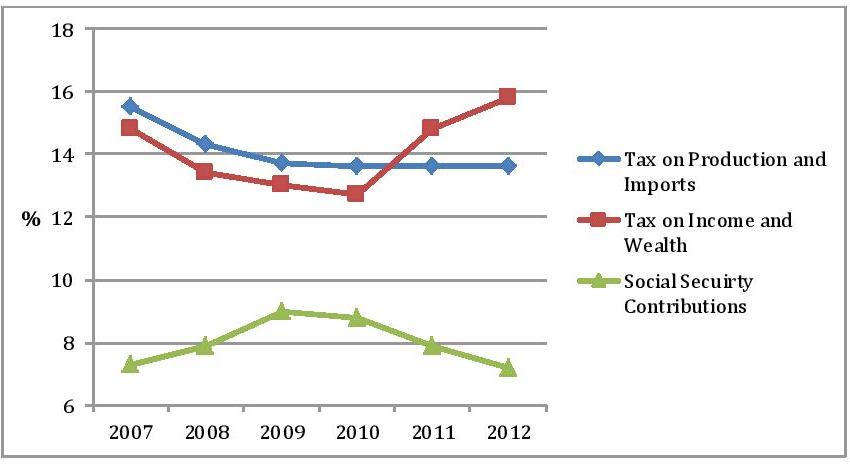
Source: Eurostat
Figure 2 shows that the recent rise in tax revenue is mainly as a result of the significant increases in taxes on wealth and income, and partly due to taxes on production and imports stabilising. In 2012 roughly 20% of the share of total taxation was from SSC, with 33% of total taxation recorded from taxes on wealth and income, and 41% recorded from taxes on production and imports respectively 2.
Notes:
1Taxation Trends In The European Union’ 2013
2 Breakdown of tax revenue by country and by main tax categories.
About author
Related Articles
-
-

Household Energy Prices in Ireland
10 Jan 2018 -

Low Tax Burden On Labour In Ireland
29 Nov 2017 -

79 Merrion Square, Dublin 2, Ireland
tel: 353 (1) 676 0414 | email: info@publicpolicy.ie
Company registration number: 504956
Privacy Policy | Chairman's Blog | Events | Video | Public Policy Documents | News Property Tax Ireland | Pension Reform Ireland | Water Charges Ireland