


CSO Data Shows An Increase In Living Standards
20 Dec 2017Key Point
The results from the 2016 Survey of Income and Living Conditions (SILC) show an increase in living standards and a significant reduction in those experiencing “enforced deprivation1 ”.
Summary of Main Findings
- Median annual equivalised disposable income2 increased by 3.0% on 2015.
- Enforced deprivation was experienced by 21.0% of the population, down from 25.5% in 2015 and 30.5% in 2013.
- There was no statistically significant change in the distribution of income over 2015.
- The following did not show any statistically significant change in 2016 over 2015.
- Gini coefficient in 2016 was 30.6% compared with 30.8% in 2015.
- The quintile share ratio3 remained at 4.7.
- The deprivation rate for those at risk of poverty was 50.7%.
- The consistent poverty4 rate was 8.3%,
- The ‘at risk of poverty’ rate was 16.5%.
Other Findings
Education pays. Those with a third level degree or above had a median equivalised real disposable income 2.1 times those with a primary education or below.
Work pays. The consistent poverty rate of the unemployed (26.3%) was over 13 times that of those at work (1.9%) and over 12 times that of those who were retired (2.3%).
Children are the worst affected by consistent poverty. The level of consistent poverty of those aged under 18 was 11.1 %; over 5 times that of those aged 65 or more (2.1%)
Increases in Living Standards
The results show significant increases in living standards for most categories over the period 2014-16. The data is shown in Table 1.
Table 1
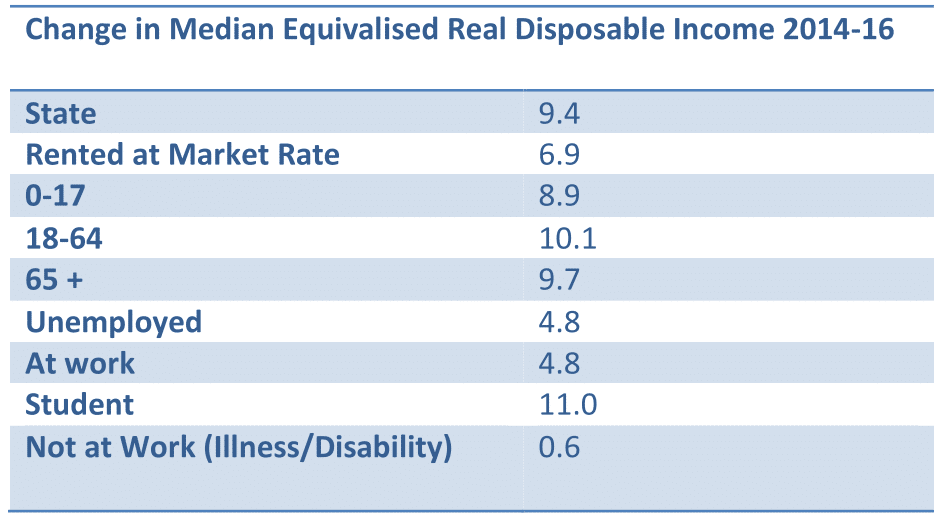
(Source: SILC 2016, Table 1e)
Care should be taken in interpreting these figures. For example, the RTB Rent Index shows an increase in rents of 16.5 per cent in the 2 years to 2017 Q2.
The results also show significant increases in disposable incomes per decile over 2014, particularly for the bottom and middle deciles. The data are in table 2.
Table 2
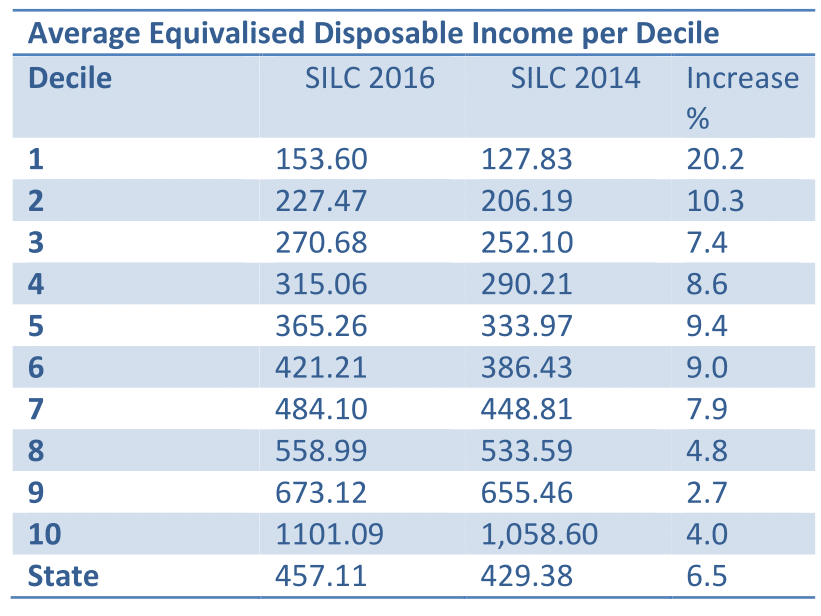
(Source: SILC 2016, Table A2)
________________________________
Notes:
1 Households that are excluded and marginalised from consuming goods and services which are considered the norm for other people in society, due to an inability to afford them, are considered to be deprived. Individuals who experience two or more of eleven items are considered to be experiencing enforced deprivation. This is the basis for calculating the deprivation rate.
2 Disposable household income is divided by the equivalised household size to calculate equivalised disposable income for each person, which essentially is an approximate measure of how much of the income can be attributed to each member of the household. This equivalised income is then applied to each member of the household.
3 The quintile share ratio is the ratio of the average equivalised income received by the 20% of persons with the highest income (top quintile) to that received by the 20% of persons with the lowest income (lowest quintile).
4 An individual is defined as being in ‘consistent poverty’ if they are both at risk of poverty and are living in a household deprived of two or more of eleven basic deprivation items.
About author
Related Articles

79 Merrion Square, Dublin 2, Ireland
tel: 353 (1) 676 0414 | email: info@publicpolicy.ie
Company registration number: 504956
Privacy Policy | Chairman's Blog | Events | Video | Public Policy Documents | News Property Tax Ireland | Pension Reform Ireland | Water Charges Ireland