


Social Protection Spending 2015
19 Dec 2016Key Point
Social Protection payments continued to be the largest component of Government spending in 2015, totalling €19.97 billion. The updated ‘Survey on Social Benefits’ provides key information on social protection payments, including recipient numbers and expenditure on 60 different schemes. You can read the full Survey here.
Social Protection System
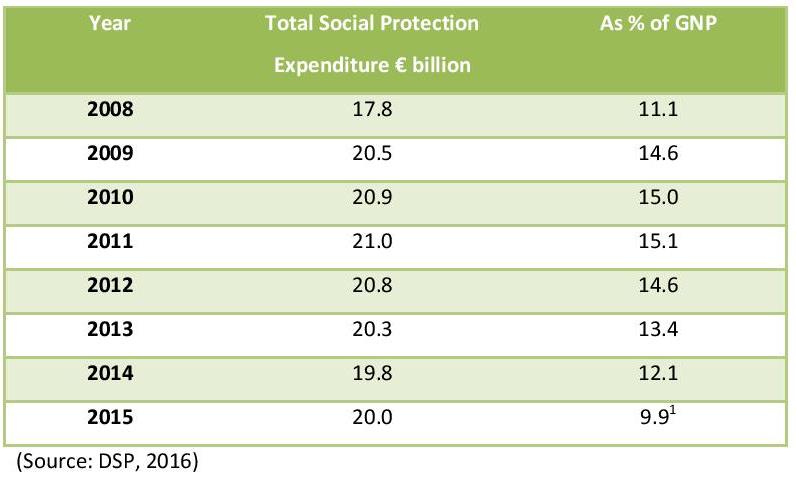
The Department of Social Protection (DSP) spent €20 billion on schemes, services and administration in 2015, a marginal increase of 0.7 per cent compared to 2014 (€19.8 billion).
Total expenditure on social protection is estimated at €19.8 billion for 2016. Table 1 shows social protection expenditure between 2008 and 2015.
Table 1 – Social Protection Expenditure, 2008 – 2015
The total number of recipients of weekly social protection payments in 2015 was 1.38 million. This is a reduction of 4.4 percent (63,318) over 2014. When qualified adults and children are included, there were 2.11 million beneficiaries in 2015 (a decrease of 4.9% or 108,674) – 45.5 per cent of the population were beneficiaries of social payments in 2015. The reduction in the unemployment rate is contributing to the fall in recipient numbers. The seasonally adjusted unemployment rate as of November 2016 was 7.3% (160,700 people). The rate was 9.1% (196,700) a year previously.
Payments by Group
Payments of the Department of Social Protection (DSP) go to three main groups of people (or programmes); children, people of working age, and retired and older people. Full details on all schemes may be accessed here. Figure 1 shows the percentage of DSP spending that goes to each of these cohorts, including supplementary payments.
Figure 1 – Expenditure by recipient type as % of total expenditure in 2015*
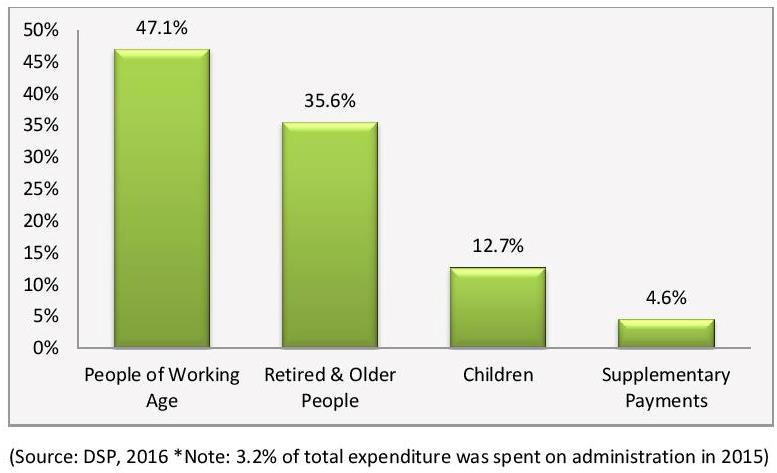
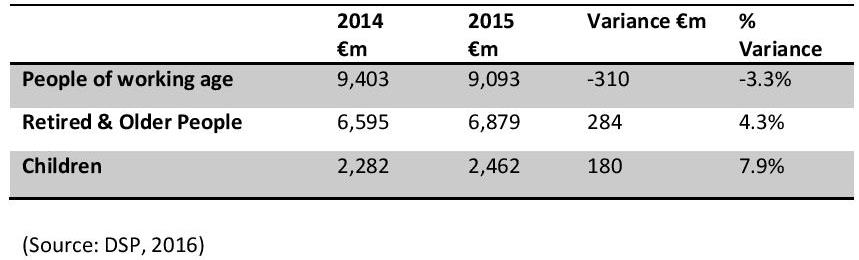
The largest proportion of expenditure (47.1%) goes towards people of working age, followed by retired and older people (35.6%), and children (12.7%). Table 2 shows the expenditure amounts in 2015 on these three cohorts relative to 2014.
Table 2 – Expenditure by Group in 2015, €m
Read the full Social Benefits report here.
_______________________________________
Notes:
1 Ireland experienced exceptionally high growth in GDP and GNP in 2015. This was driven by transfers of intangible assets (including licences and patents) by a number of multinational enterprises. The increase in the stock of intangible assets, used in supporting contract manufacturing arrangements, resulted in higher production that was attributable to Ireland. Although the nominal amount of social protection expenditure increased by 0.7% in 2015, the ratio to both GDP and GNP fell sharply
About author
Related Articles
-
-

Social Protection – Expenditure Trends
28 Aug 2017 -

79 Merrion Square, Dublin 2, Ireland
tel: 353 (1) 676 0414 | email: info@publicpolicy.ie
Company registration number: 504956
Privacy Policy | Chairman's Blog | Events | Video | Public Policy Documents | News Property Tax Ireland | Pension Reform Ireland | Water Charges Ireland