
 In An EU Context)


Irish Regional GDP Per Capita (PPS) In An EU Context
7 Apr 2014Eurostat recently released a report detailing the GDP per capita, expressed in terms of purchasing power standards (PPS)1, of not only the different member countries but also including a comparison between the GDP per capita of the different EU 28 regions.
GDP per capita provides a measure of the total economic activity in a region. GDP per capita expressed in terms of Purchasing Power Standards enables comparisons be made of levels of economic activity between different sized economies, regardless of their price levels. This note highlights the countries and regions with a similar level of productivity to Ireland, the BMW Region, the S&E Region, and Northern Ireland. We use GNP as the baseline for Ireland so as to give a more realistic comparison.
In Ireland there are two regions; the Border, Midland and Western Region (BMW) and the Southern and Eastern Region (S&E).
The BMW Region covers 47% of the landmass of the country and includes 27% of the population and comprises the following 13 counties:
Border Region: Cavan, Donegal, Leitrim, Louth, Monaghan and Sligo
Midland Region: Laois, Longford, Offaly and Westmeath
Western Region: Galway, Mayo and Roscommon
The S&E Region is the larger of the two designated regions and covers 53% of the total landmass of the country. The region includes the capital, Dublin, and the three other main cities of the Republic; Cork, Limerick and Waterford. Like the BMW Region, the S&E Region also consists of 13 counties as follows:
Mid-East Region: Meath, Kildare, Dublin, Wicklow
South-East Region: Carlow, Kilkenny, Wexford, Waterford, South Tipperary
South-West Region: Cork and Kerry
Mid-West Region: Limerick, Clare, North Tipperary
The Eurostat report used GDP per capita adjusted for PPS to compare regions. We use GNP for Ireland as opposed to GDP.. Due to the high net factor outflows leaving the country (arising from the large multi-national sector), GNP gives a better indicator of our position2.
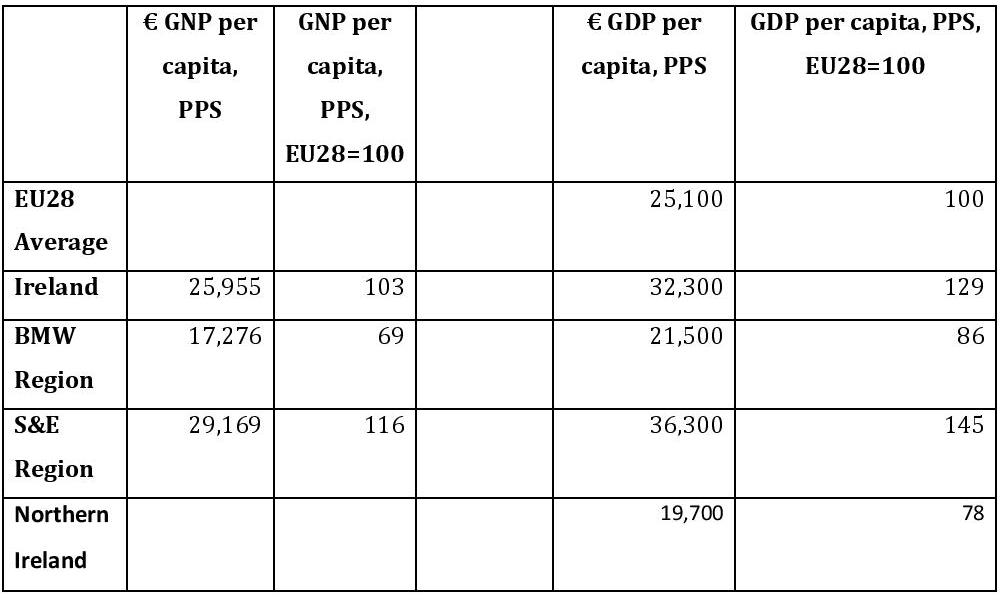
Using GNP per head for Ireland we are at 103 % of the EU average in 2011. The BMW Region was at 86% of the EU average and the S&E Region was at 117 %. Northern Ireland (in GDP terms) was at 78% of the EU average.
Table 1: PPS GDP per capita (GNP for Ireland), 2011.
The EU countries and regions that are in-line with Ireland when GNP is used as the base for Ireland are displayed in graphs 1, 2 and 3 below.
Graph 1: PPS GDP per capita of Selected Countries [Ireland (GNP)]
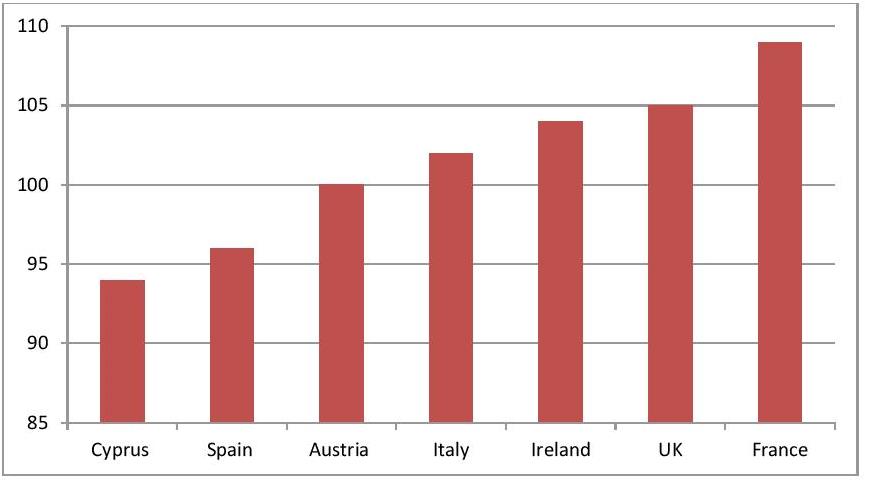
Source: eurostat
Graph 2: PPS GDP per capita of Selected Regions [Irish BMW Region (GNP)]
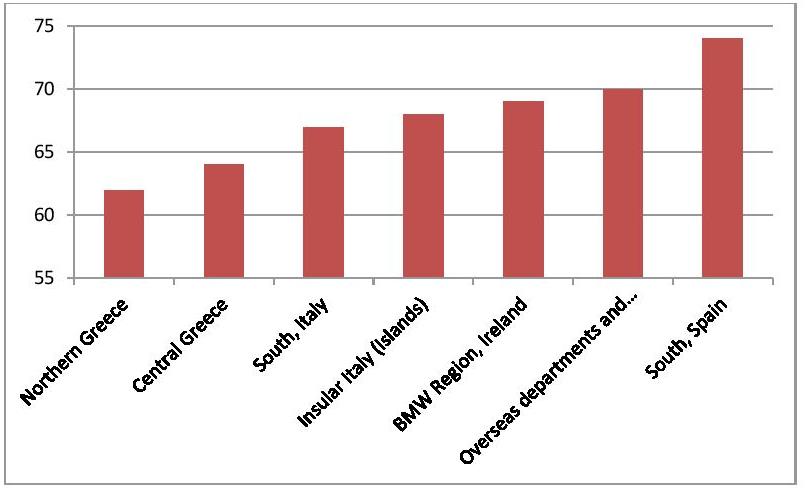
Source:eurostat
Graph 3: PPS GDP per capita of Selected Regions [Irish S&E Region (GNP)]
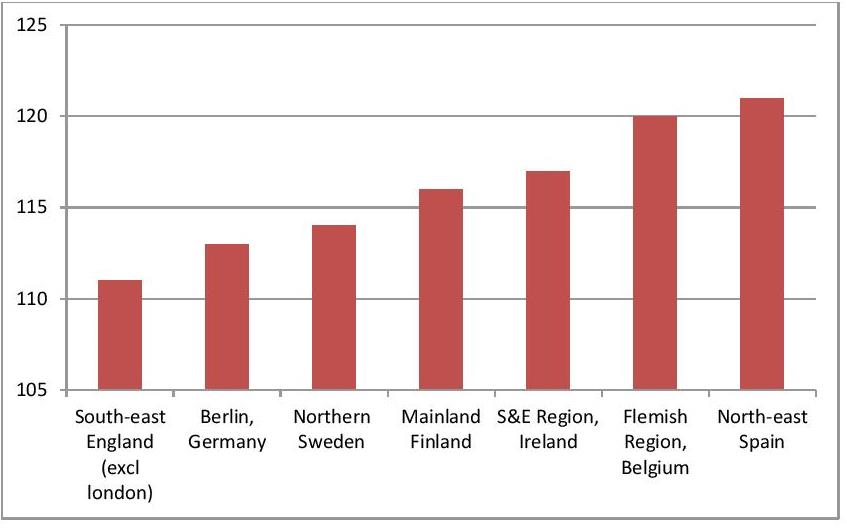
Source: eurostat
Notes:
1 Aggregates expressed in PPS are derived by dividing aggregates in current prices by respective purchasing power parity (PPP)
2 International Comparisons of Taxation and Public Spending and GNP-GDP.
About author
Related Articles
79 Merrion Square, Dublin 2, Ireland
tel: 353 (1) 676 0414 | email: info@publicpolicy.ie
Company registration number: 504956
Privacy Policy | Chairman's Blog | Events | Video | Public Policy Documents | News Property Tax Ireland | Pension Reform Ireland | Water Charges Ireland