

Fiscal Update – Q4 2014
5 Feb 2015Context: The End of Austerity
Full 2014 Exchequer figures are now available, showing a significant improvement in the fiscal situation. By year’s end, the exchequer deficit reached just under €8.2b, down from €11.5b at the end of 2013 and €1.4b less than anticipated under Budget 2014. The healthier-than-expected state of the government finances comes off the back of a surprisingly strong economic recovery in 2014, prompting the government to introduce a mildly expansionary Budget in October that, while aiming to comply with the Excessive Deficit Procedure target of a General Government Deficit below 2.9% of GDP, brought to an end the era of austerity.
Nevertheless, the Exchequer Deficit for 2014 is roughly €250m larger than was anticipated in Budget 2015, implying a slightly larger General Government Balance of -3.9% of GDP, compared to the Budget 2015 figure of -3.7%. Confirmation of last year’s deficit will come in April with the publication by the CSO of the Government Finance Statistics, but is likely to come within the Excessive Deficit Procedure target of 5.1% of GDP.
Comparing the exchequer deficit forecast for 2015 contained within Budget 2015 with the estimate from the pre-Budget White Paper – which is estimated on the basis of a neutral Budget – reveals that Budget 2015 tax cuts and expenditure increases are expected to increase the deficit for 2015 by nearly €800m, making this the first expansionary Budget since Budget 2009. It should be noted that this figure excludes the subsequent policy decisions regarding the funding model for Irish Water, which reduced the expected net revenues from Water Charges in 2015.
Exchequer Balance
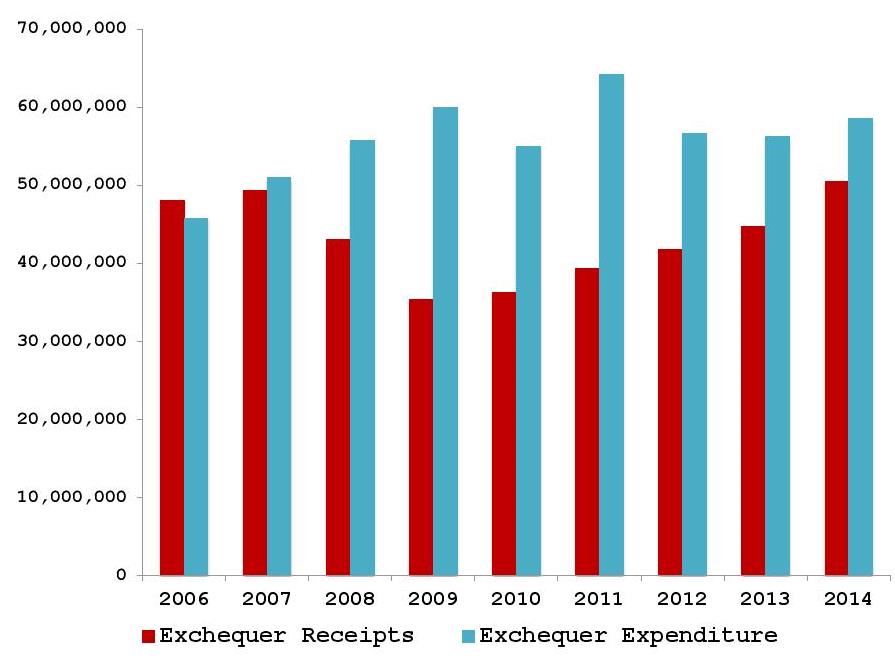
The cumulative exchequer deficit for 2014 stood at just under €8.2b, a narrowing of €3.3b compared to the deficit in 2013. The average monthly deficit was €682m. Graph 1 below shows net cumulative exchequer receipts and expenditures for the years 2006-2014.
Graph 1: December Exchequer Returns (€000’s)
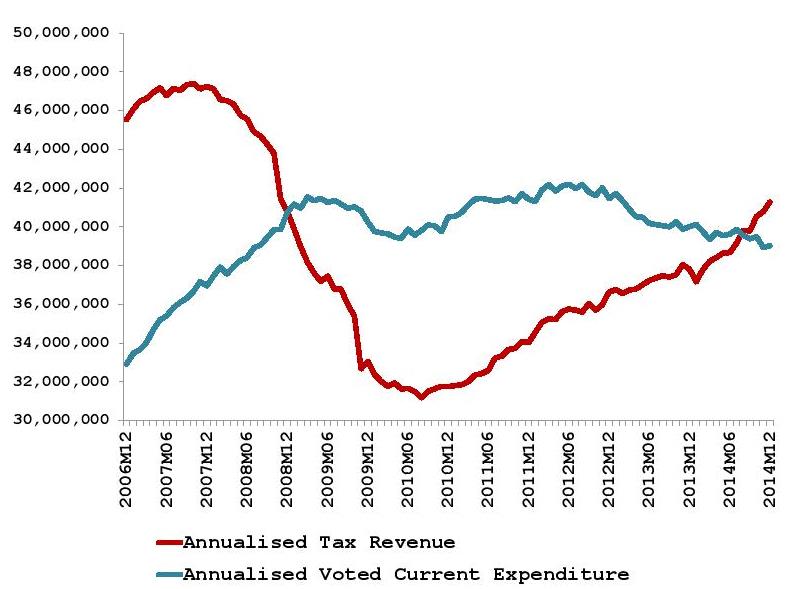
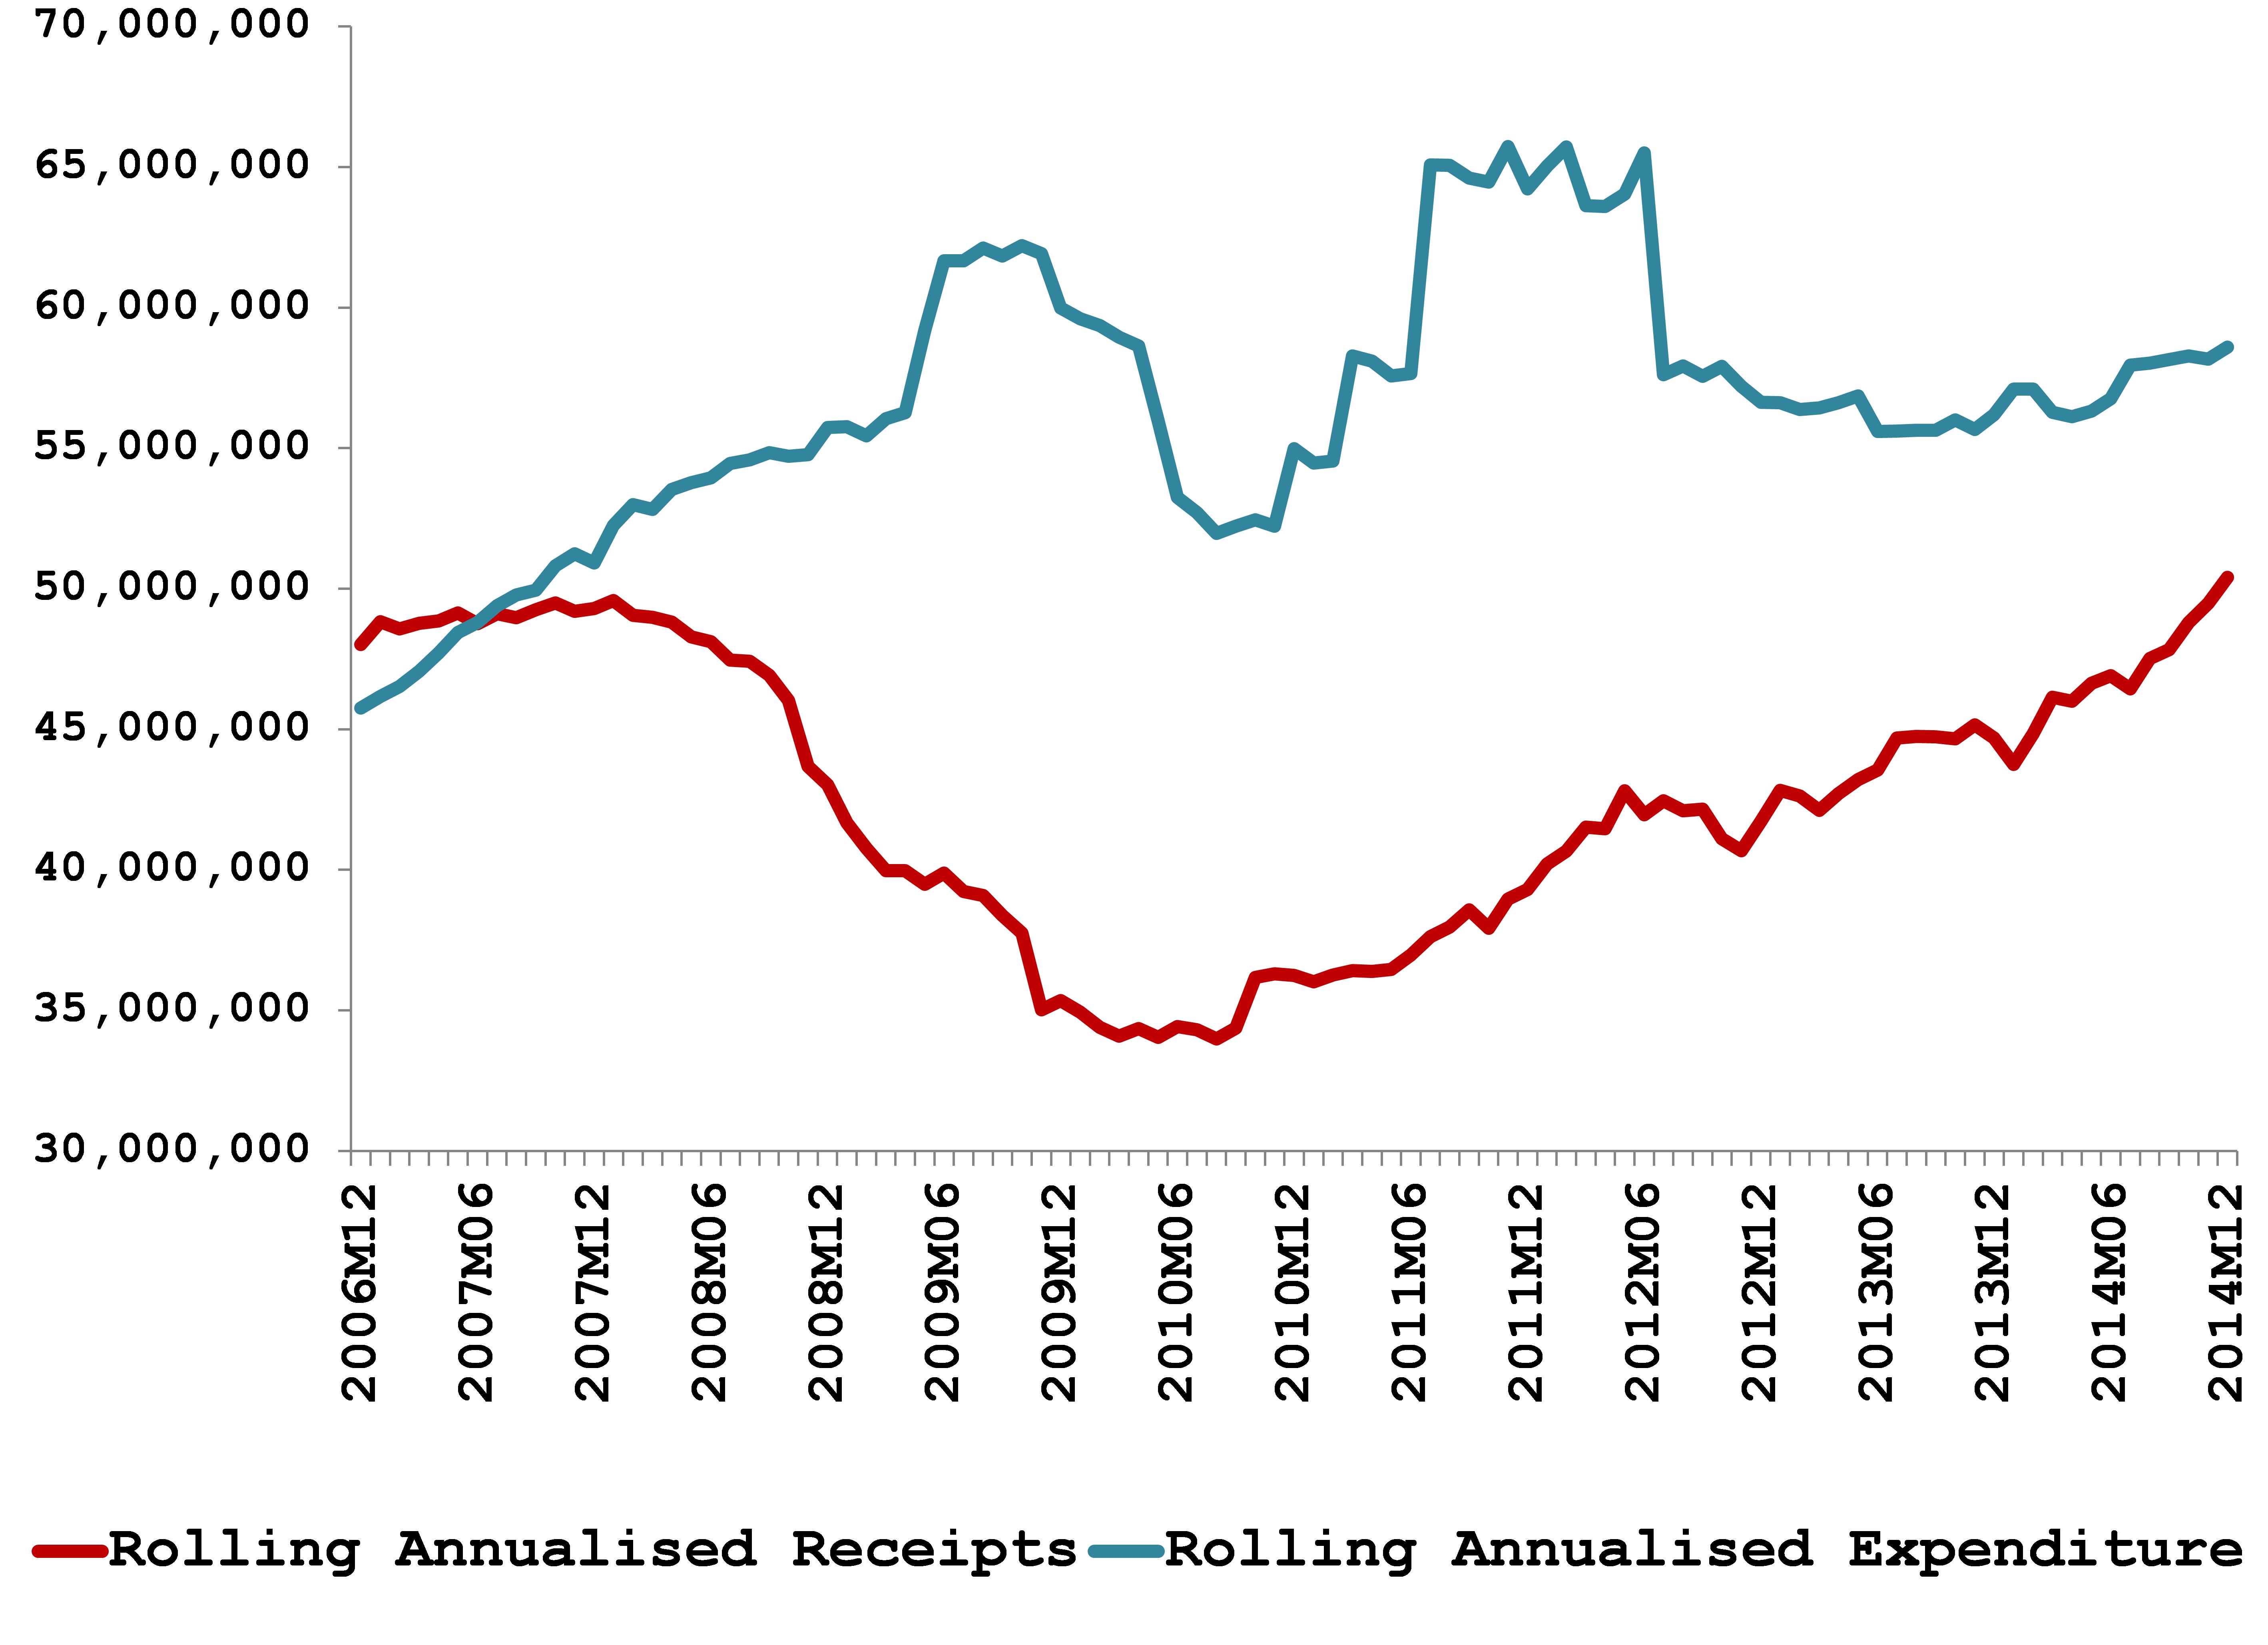
A simplistic approach to fiscal solvency is to check whether the government takes in enough in taxes to cover public sector salaries and other basic running costs of public services. Graph 2 below shows rolling annualised Tax Receipts and Voted Current Expenditure from late 2006. A significant gulf grew between the two figures developed from 2009 onwards, with the difference slowly being reduced via fiscal consolidation. Recent data show that annualised Tax Receipts exceeded the day-to-day public sector running costs in August of last year. While much of this turn-around is attributable to the significant recovery in Tax Receipts – both as a result of increased tax rates and recovery in the underlying economy – the contribution from public spending should be seen in the context of significant increases in demand for public services due to unemployment and the aging population. The relatively flat profile of Voted Current Expenditure therefore masks significant discretionary reductions in the running costs of the public services.
Graph 2: Exchequer Tax Revenue and Voted Current Expenditure (€000s)
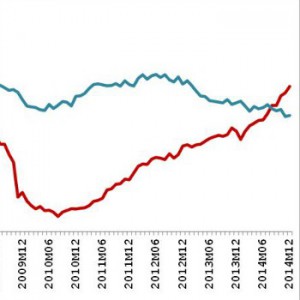
Graph 3 shows the difference between two broader categories of income and expenditure – total current receipts and total current expenditure. The major difference between the two diagrams is the inclusion of national debt interest payments, which highlights the ongoing burden of our substantial public debt. Nevertheless, the gap between current spending and income has narrowed to its smallest point since March 2009.
Graph 3: Exchequer Total Current Receipts and Total Current Expenditure (€000s)

Graph 4 adds capital receipts and expenditures to the analysis. Although Voted Capital Expenditure bore a disproportionate share of expenditure reductions in recent years (see our previous article on the changing composition of government expenditure here) two significant spending spikes can be seen in the period between 2008 and 2012, representing the impact on the exchequer of the bank bailouts.
Graph 4: Exchequer Receipts and Expenditures (€000s)
2014 Tax Receipts
Tax revenues for 2014 amounted to €41.3b. Analysis of these revenues can be based on comparisons with either the figures for the previous year – which show an increase in 2014 of €3.5b (9.2%) – or with the government’s predicted profile of receipts and expenditures – against which 2014 tax revenues were €1.2b (3.1%) higher. The former gives insight into the health of the public finances generally and the strength of the underlying economy, whereas the latter is more useful for determining the performance of specific tax heads relative to the expectations.
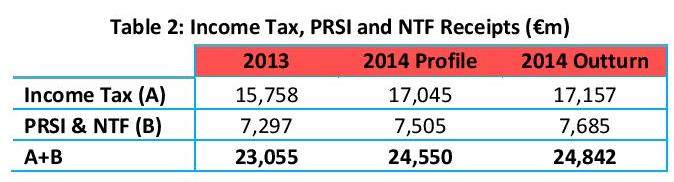
2014 Tax receipts amounted to €41.3b, up €3.5b (9.2%) on 2013 and €1.2b (3.1%) ahead of the Department of Finance expectations.
Income Taxes: Owing to increasing employment throughout 2014, income taxes (including the Universal Social Charge) rose by €1.8b (7.8%) compared to 2013. Interestingly, despite robust employment growth income taxes were only slightly above profile, which suggests that the driver of our fiscal over-performance is to be found elsewhere.
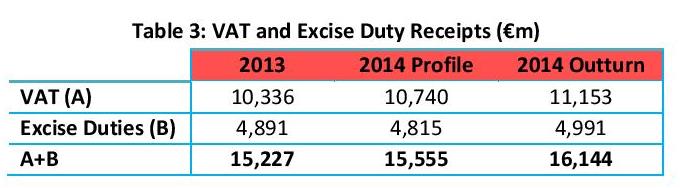
Consumption Taxes: As can be seen from Table 3, taxes on consumption have also grown strongly since 2013. However, in contrast to income taxes, consumption taxes are also significantly above profile. VAT receipts had been expected to grow by 3.9% last year, but instead grew by 7.9%. Excise Duties had been expected to fall by 1.6%, but actually grew by 2%. These increases reflect rising consumer expenditure, particularly on tax-rich cars.
Corporation Tax: Half way through 2014, the outlook for Corporation Tax revenue was not so good, with receipts down on the same period in 2013 and below profile. However, a strong second half of the year brought a turn-around in Corporation Tax receipts, with the final December numbers showing an increase of €344m (8.1%) on last year, €234m (5.3%) ahead of profile.
Local Property Tax: Receipts from the Local Property Tax came in 10.7% below expectations for 2014. Given the relative stability of the tax base, it is perhaps surprising that property tax receipts have under-performed. However, the pattern of payment has changed as tax payers move towards phased payment methods and away from pre-paying upfront for their 2015 tax bill, which reduces receipts received in 2014 and increases the expected yield for 2015. Furthermore, the deadline for 2015 payments was moved from December 31st to January 7th, which would have a similar impact. Exchequer Returns for January appear to confirm this, as LPT receipts came in €33m ahead of profile.
About author
Related Articles
-
-

Ireland’s Path towards Fiscal Sustainability
10 Apr 2014
79 Merrion Square, Dublin 2, Ireland
tel: 353 (1) 676 0414 | email: info@publicpolicy.ie
Company registration number: 504956
Privacy Policy | Chairman's Blog | Events | Video | Public Policy Documents | News Property Tax Ireland | Pension Reform Ireland | Water Charges Ireland