


Evidence On The Incentive To Work
15 May 2013Introduction
This note assesses recent evidence on the incentive to work. It discusses the measures by which economists gauge work incentives and outlines the results of various empirical studies. Despite a relatively generous welfare net and the costs associated with working, most of the evidence suggests that the majority of unemployed people would be better off in a job.
Replacement Rate
A key measure of the financial incentive to work is the ‘replacement rate’ (RR) – the ratio between net income out of work and net income when in work.
![]()
For example, if an unemployed person’s income is €100 when unemployed compared with €200 when employed, the replacement rate is simply 50%. The higher this rate, the more likely an unemployment trap can emerge where an individual’s out of work disposable income compares favourably with in work disposable income, undermining the incentive to work. Table 1 below shows replacement rates at 67% of the average wage for the OECD, with Ireland highlighted. It appears that replacement rates are highest for married couples, both with and without children. These figures suggest the rates in Ireland are significantly below other OECD countries.
Table 1: Replacement rates for six family types in the OECD in 2011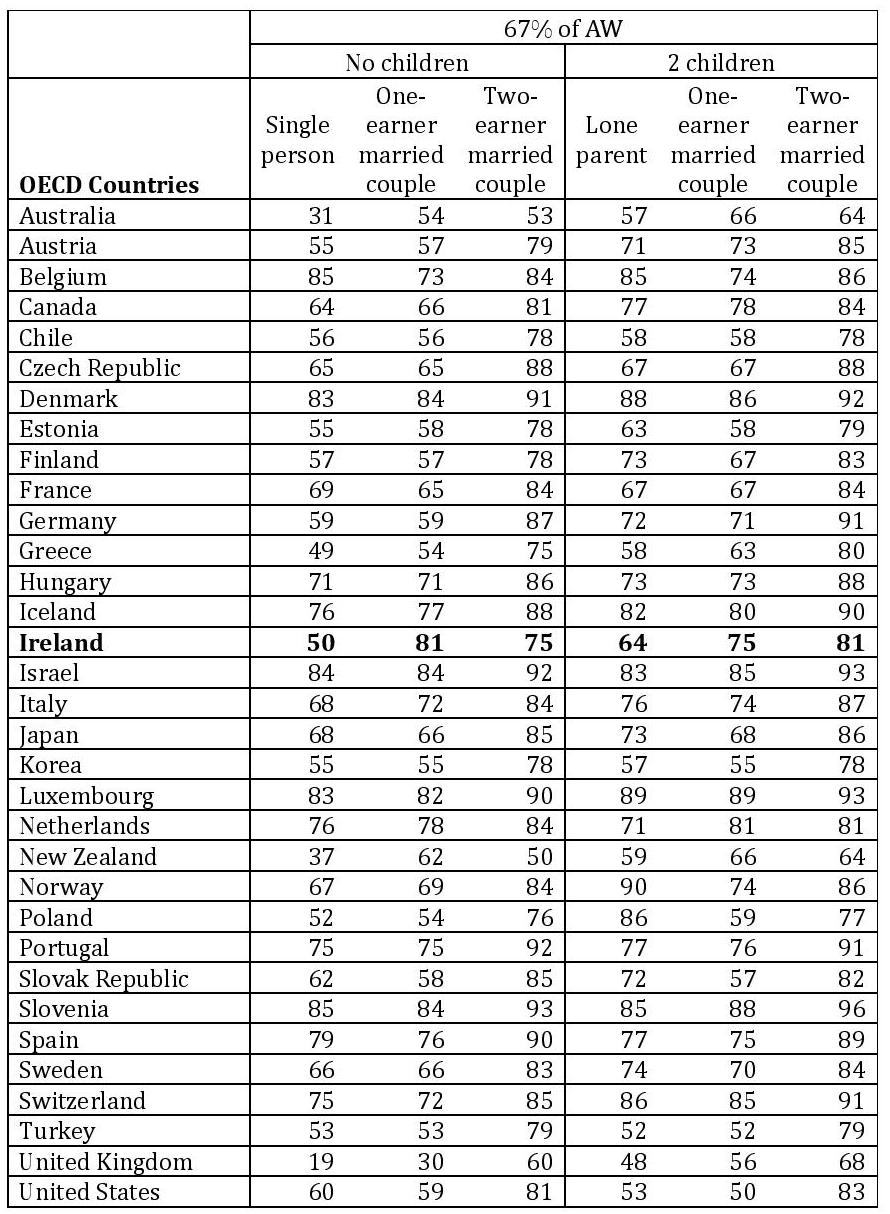
Source: European Commission.
Similar statistics are available from the Department of Finance , which reports replacement rates for various levels of in-work income, given in Table 2. These calculations of in-work income take account of income from employment, taxation, PRSI, income levy, spouse’s entitlement to jobseeker’s allowance, family income supplement and one parent family payment. A replacement rate of 70% or above is considered a danger zone (shaded in grey). 2011 figures show disincentives to take up employment at low income levels even where in-work income at these levels may be supplemented by social welfare payments such as the Family Income Supplement and jobseeker’s allowance for the spouse. The bottom panel also points toward a disincentive for the spouse to take up work at the minimum wage when the other half of the couple is in employment. 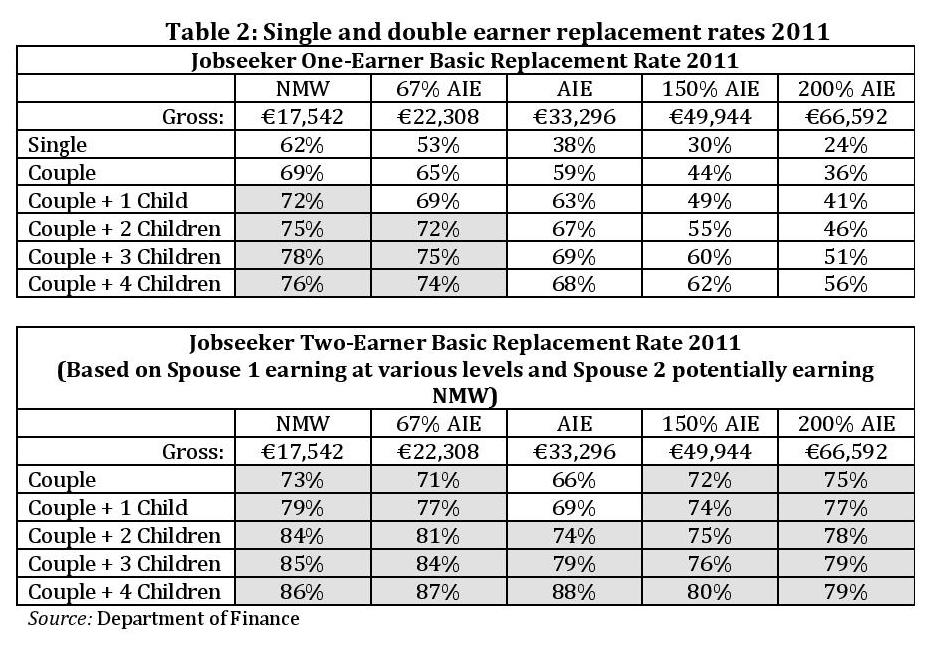
Such calculations are somewhat simplistic as they rely on hypothetical examples of in-work income. In their 2011 paper, Callan et al seek instead to predict the in-work income of someone who is unemployed based on their characteristics (age, education, marital status, gender). Individual level data is compiled from a large sample of Irish households and compares household disposable incomes under situations of employment and unemployment. Their analysis finds that average potential earnings of the unemployed in Ireland are close to two thirds of average wages. Replacement rates calculated in this paper for single unemployed individuals in 2007 are 46% (at 67% of the average wage) and 33% (at 100% of the average wage). These were among the lowest in the OECD for that year, but one should bear in mind that this is for single persons only. Table 3 shows the distribution of replacement rates for Ireland in 2011 – it gives the percentage of unemployed persons in various replacement rate intervals.
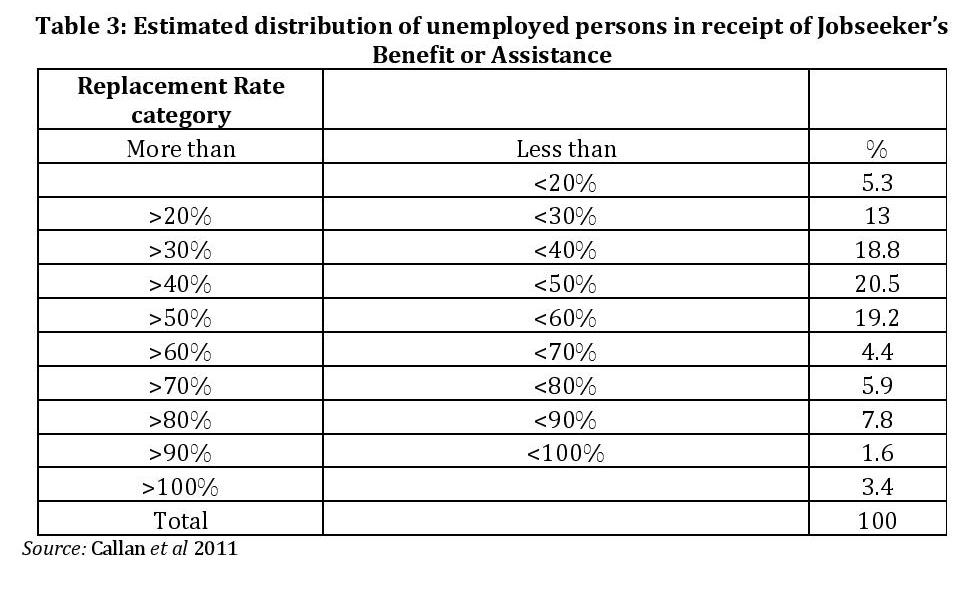 The bulk of individuals face a replacement rate of less than 60% (i.e. 8 in 10 unemployed individuals), while only 3% have a replacement rate of over 100% (that is, they would earn more unemployed than in employment).
The authors also compare 2011 replacement rates with those in 1987, 1994, 2000 and 2008 (adjusted for wage growth/decline in the intervening years). The most striking result is that the number of 2011 replacement rates above 70% are significantly lower than in 1987, 1994 and 2008, while for replacement rates above 90%, 2011 and 2000 are very similar. Over time, the incidence of high replacement rates was highest in 1987 and 1994, and fell between 2008 and 2011. The authors conclude that these results suggest that measures taken between 2008 and 2011 served to maintain a significant incentive to work for most unemployed people.
Costs of Working
One aspect not considered in Callan et al (2011) is the day to day outlays involved in maintaining a job. In their 2012 Working Paper, Crilly et al seek to capture the costs such as childcare, transport and meals which are incurred by choosing to work. The authors contend that replacement rates constitute an imperfect measure of work incentives because replacement rates compare gross income levels before subtracting costs of working which may pose a disincentive to work. Similar research undertaken by the Institute for Fiscal Studies in the UK showed that work related expenses have a negative and important effect on work incentives. The authors estimate the average extra weekly expenditure on food, clothing and transport for a single employed person is €177.82 – about 5 times that of an unemployed person, for which it is €35.39 (in the case where neither person has children). The difference amounts to €142.43 per week and €6,836.64 annually. For an employed principal breadwinner with one child under five, the additional cost is €227.83, which is €185.86 more than for an unemployed principal breadwinner with one child under five. These figures rise as more children under five are in the household, increasing to about €9,000 per year for one child under the age of five. The graph below plots the differences in weekly income when employed against being unemployed.
Figure 1: Difference in Weekly Income When Employed Against Being Unemployed (€) 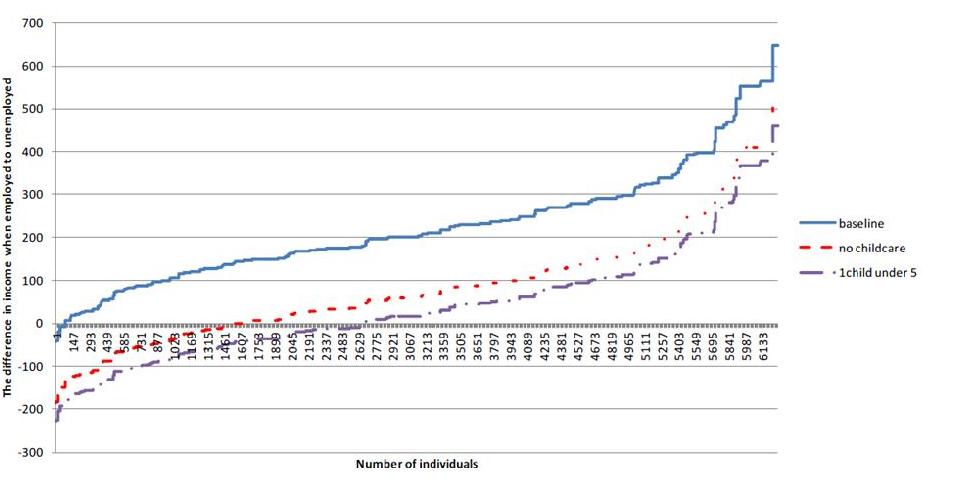
Source: Crilly et al 2012
Figure 1 (taken from the paper) shows that under the baseline scenario 81 (1%) individuals out of the 4,028 included in the sample have higher incomes when unemployed. This compares to 1,554 (25%) individuals when the additional costs are included without childcare and 2,686 (44%) individuals with childcare for one or two children under five years old; the latter of which is just under half of the sample. This number falls to 1,635 (26%) with no children under 5 years old. The authors conclude that costs of working in Ireland are high and this may provoke a significant disincentive to work.
Criticisms of ‘The Costs of Working in Ireland’
In a critique of ‘The Costs of Working in Ireland’, Seamus McGuinness and Philip O’Connell argue that the estimation of income from returning to work is understated because it does not control for the age of an individual, part time and full time workers and type of employment. The estimations of costs, meanwhile, related solely to full time workers. McGuinness and O’Connell re-estimate income by accounting for age, work experience – using a more detailed data set – and focus specifically on full time employed and unemployed persons. Figure 2 shows incentive to work in a full-time position using the costs initially estimated in Crilly et al (2012) but with re-estimated income
Figure 2: Re-estimated Difference in Weekly Income: Full-Time Employees and Unemployed 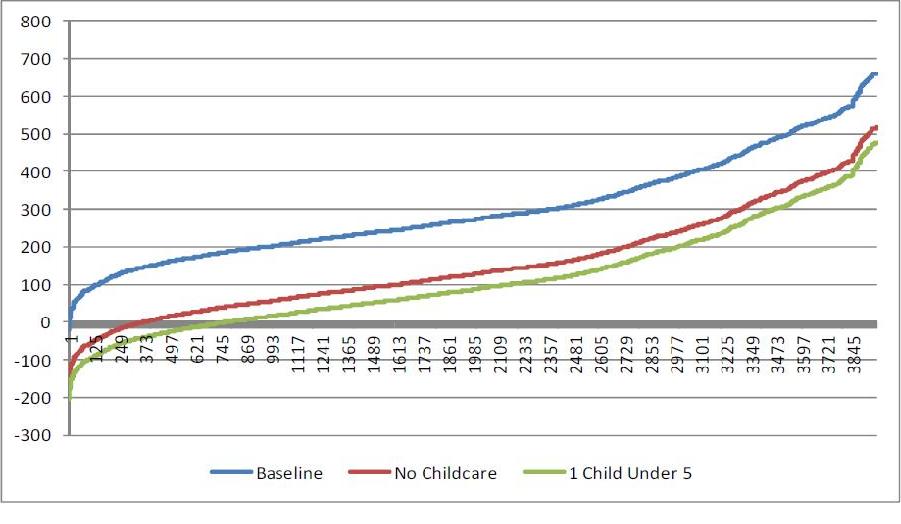
Source: McGuinness & O’Connell 2012
Figure 2 shows that the estimated percentage of individuals for whom being in unemployment pays more than the costs of taking employment is different from the earlier estimation (compare with Figure 1) – its pays for only 9% with no children and 19% for individuals with one child under five – substantially lower than the original estimates.
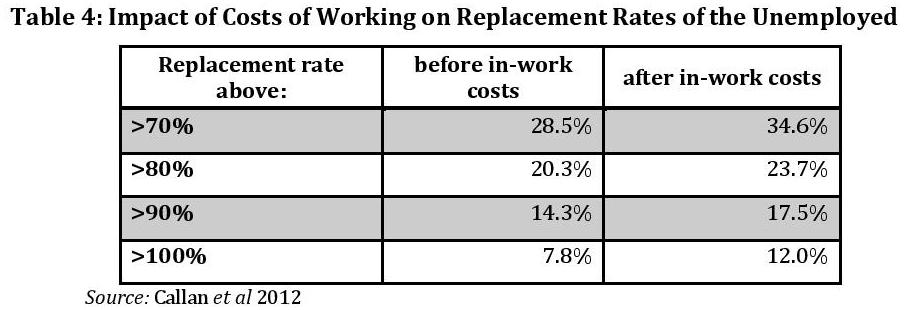
The latest estimates of the incentive to work come from Callan et al 2012 in an update of their 2011 paper referenced above. As in their earlier work, income in and out of work is predicted on the basis of individual characteristics. However, the authors include estimates of the costs associated with working – namely transport and childcare costs – using more detailed and recent data than used in Crilly et al(2012). Interestingly, the work-related transport costs are found to be lower than in the Crilly et al paper, but the cost of childcare is found to be significantly higher. The authors find that the fraction of people with a young child that are better off not in work is between 12% and 13%, compared to 44% in Crilly et al and 19% in McGuinness & O’Connell. For people without a young child, only 4% are found to be better off, as opposed to 15% in Crilly et al and 9% in McGuinness & O’Connell. Table 4 shows how the inclusion of estimates of the costs of working impact on the fraction of unemployed people facing high replacement rates.
Looking more generally at the impact of high replacement rates, the authors note that replacement rates in 2005 were higher than they are today, but the unemployment rate was only 4% in 2005 compared to 14% currently. This suggests that Ireland does not have a generalised problem of high replacement rates damaging incentives to work. Moreover, 6 out of 10 people facing high replacement rates (over 70%) in 2011 are found to be in employment. Of those who are estimated to be worse off in employment, 3 out of 4 have a job.
These results highlight the limited nature of analyses based on the use of replacement rates. Replacement rates only ever capture a snapshot at a point in time, whereas many people endure periods where it may not pay to work in the expectation that their wages will be higher in the future.
Tagged with:
Work
About author
Related Articles
-
-

Work Incentives (Updated)
11 Nov 2015 -
Work Incentives
4 Feb 2015
79 Merrion Square, Dublin 2, Ireland
tel: 353 (1) 676 0414 | email: info@publicpolicy.ie
Company registration number: 504956
Privacy Policy | Chairman's Blog | Events | Video | Public Policy Documents | News Property Tax Ireland | Pension Reform Ireland | Water Charges Ireland