
Dublin Bus: Funding and Financial Performance
16 May 2013Overview
This note examines the funding of state provided bus travel in Dublin and the financial performance of Dublin Bus from 2003 to 2011. Dublin Bus is under continuing pressure to reduce costs as a result of declining passenger revenue and a reduction in subvention. Payroll related costs are the largest single operating cost incurred and as such are the primary focus of cost reduction. Savings to date have been achieved by reducing overall payroll costs through a reduction in employee numbers.
The contract between Dublin Bus and the National Transport Authority is up for renewal in 2014. The NTA is currently considering competitive tendering as a policy option. We provide a brief description of competitive tendering and its potential merits and drawbacks.
Public Service Obligation (PSO) Payments
Each year public funding is provided to Dublin Bus by way of contract with the National Transport Authority (NTA). This funding is based on the premise that Dublin Bus provides a service which is “socially necessary but financially unviable1. In 2011, Dublin Bus received a PSO payment of €73million which amounts to 41 percent of the company’s revenue for that year. The PSO payment was reduced to €69million in 2012. Table 1 shows the PSO payments and total revenue for Dublin Bus from 2003 to 2011. The PSO payments have declined steadily from 2008 and are set to continue as the Department of Transport, Tourism and Sport confirmed a further PSO reduction of at least six percent in 2013. Company revenue has also declined significantly over this period from €203.7 million in 2008 to €178.3 million in 2011, a reduction of 12.5 percent.
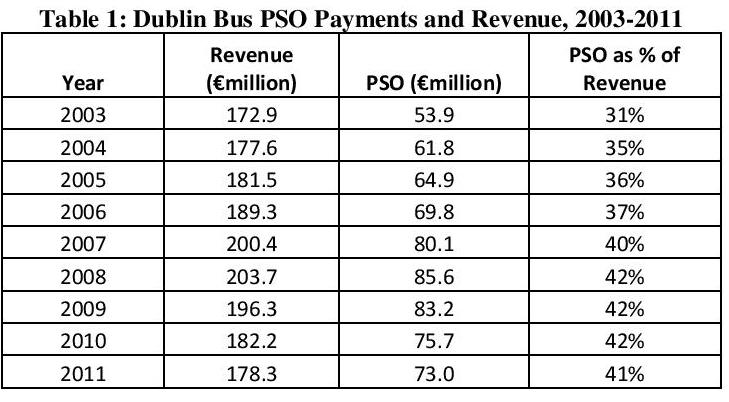
Source: Dublin Bus Annual Reports.
In 2009 Deloitte issued a report which examined cost and efficiency in Dublin Bus. According to Deloitte2, the subsidy paid to Dublin Bus is generally lower than public subsidies paid to comparable bus operations in cities outside Ireland . Table 2 compares operational subvention as a percentage of total revenue across six European cities. The bus subvention in Dublin is shown to be the lowest of the six cities which include; Lyon, Brussels, Amsterdam, Zurich, London and Dublin.
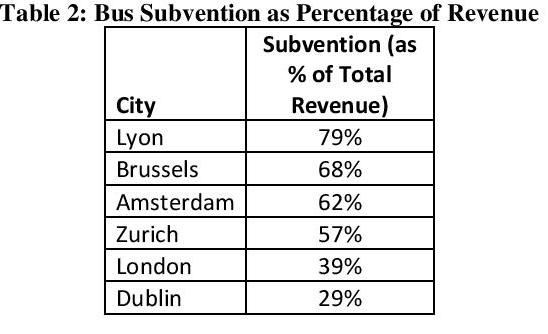
Source: Deloitte Cost and Efficiency Review of Dublin Bus and Bus Eireann, 2007.
Notes: Total revenue is customer revenue plus subvention. The figure for Dublin of 29% relates to 2007. However this rate of subvention has remained stable over the period 2007 to 2011.
Passenger Numbers
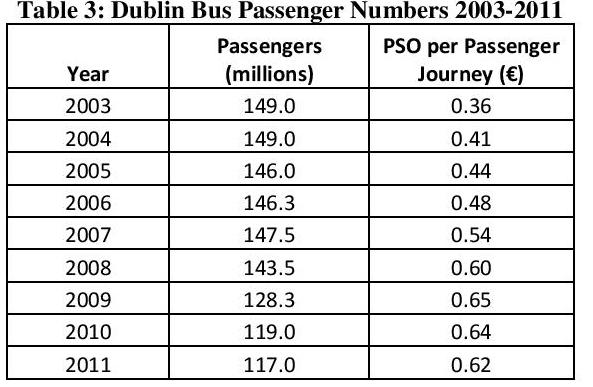
From 2003 to 2007 demand for Dublin Bus services remained relatively stable. Over this period passenger numbers averaged 147 million per annum. However 2008 marked the beginning of a period of declining demand as the recession began to take its toll on the demand for bus services. Passenger numbers in 2008 of 143.5 million fell below the predicted number of 151 million and by 2011 passenger numbers were 21 percent lower than in 2003.
The decline in passenger numbers has been accompanied by an increase in the PSO per passenger journey (from 60 cents per journey in 2008 to 62 cents per journey in 2011). The PSO per passenger in 2011 was double the figure of 2003. Table 3 below shows total passenger numbers and PSO per passenger from 2003-2011.
Source: Dublin Bus Annual Reports 2003-2011.
Operating Costs
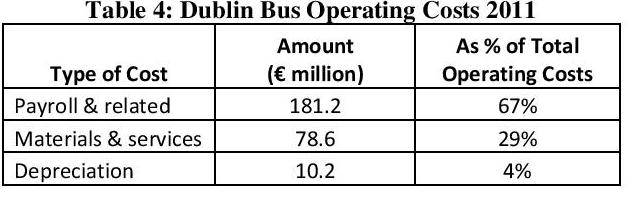
Labour costs are the main costs incurred by Dublin Bus. Payroll and related costs of €181.2 million in 2011 accounted for 67 percent of total operating costs<sup.3. Payroll and related costs are made up of wages and salaries (€154.5 million), social welfare costs (€14.9 million) and other pension costs (€11.6 million). The other major cost category is materials and services. Table 4 shows the full breakdown of total operating costs in 2011.
Since 2008 there has been pressure on Dublin Bus to bring costs in line with lower revenue. Payroll savings have been achieved by reducing staff numbers. The average number of employees in 2011 was 3,345 compared to 3,825 in 2008 (a reduction of 12.5%). Table 5 shows employee numbers, expenditure on wages and salaries and average wage from 2003 to 2011. The total wage and salary cost in 2008 was €179.6 million. This has been reduced by 14 percent to €154.5 million in 2011. Average wage over the same period has remained relatively stable.
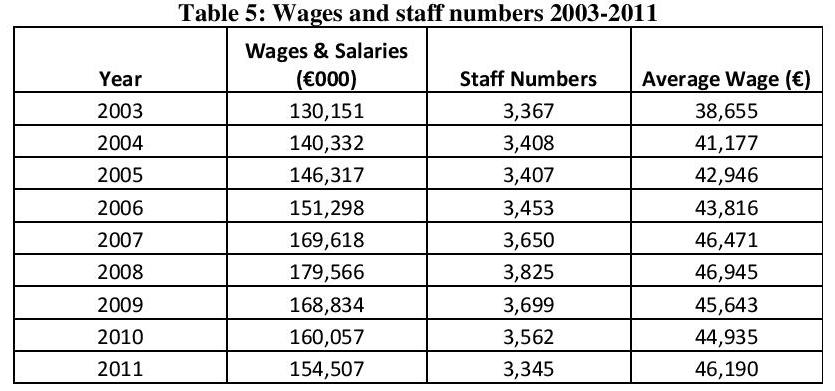
Source: Dublin Bus Annual Reports.
An International Comparison of Bus Driver Wages
UBS publish a yearly comparison of prices and earnings for various cities around the world. This includes a comparison of bus driver income and working hours4. Table 6 compares the net income per year in USD for bus drivers from various cities across the EU. The income relates to a bus driver employed by the municipal transport operator with 10 years experience. To make the data comparable a PPP adjustment is carried out to account for cross-country differences in the cost of living. The PPP adjusted net income of bus drivers in Dublin is the third highest of 25 EU cities.
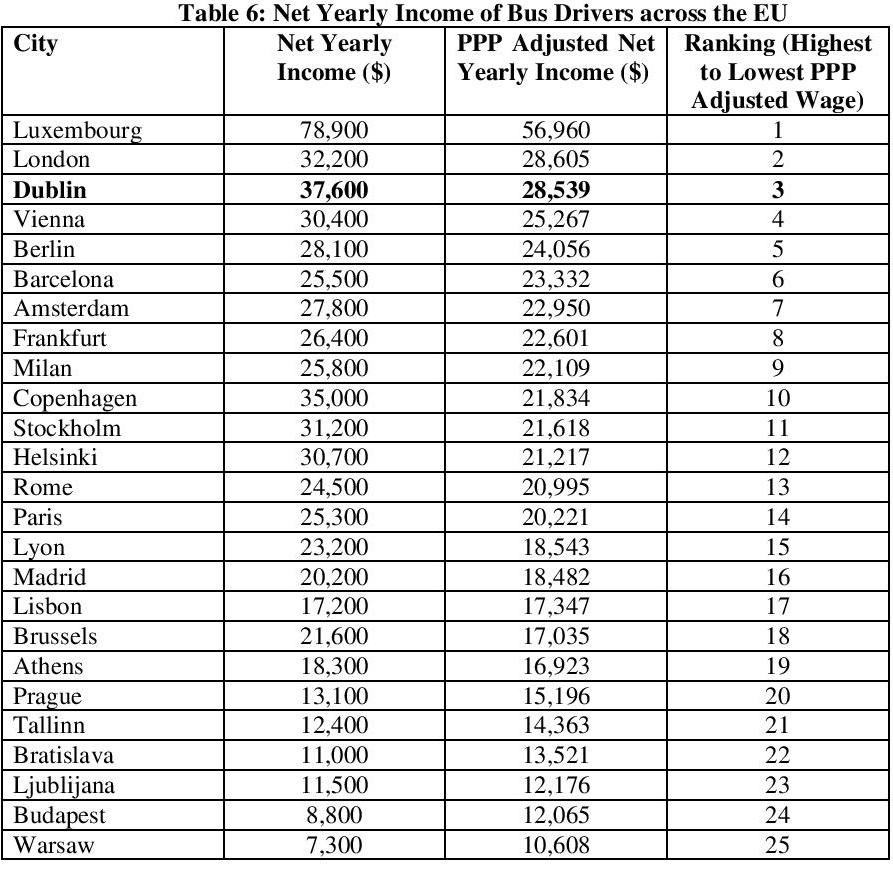
Source: UBS Prices and Earnings 2012
PPP adjustments are made using OECD adjustment factors for PPP at the country level.
Competitive Tendering as a Policy Option
In 2009 Dublin Bus entered into a contract with the National Transport Authority (NTA) which involved Public Service Obligation (PSO) payments to Dublin Bus in return for the provision of public bus services. This contract is due for renewal in 2014 and the NTA is currently assessing whether it should “undertake competitive tenders in relation to some or all of the services” . Competitive tendering would introduce competitive pressures into the bus market by requiring Dublin Bus to compete against privately run bus companies on some or all bus routes. The company that can provide the best service at the lowest cost may be awarded the contract. State subvention would still be required in order to maintain an adequate service on bus routes which are not profitable. As part of the public consultation process, competitive tendering has received support from organisations such as The Competition Authority and Chambers Ireland .
The potential cost savings are the main attraction of such an option. When a country introduces competitive tendering cost savings of 20 to 30 percent are typically achieved5 . However this has to be weighed up against the potential pitfalls. The process of competitive tendering puts pressure on the participating companies to lower costs and this may be achieved by using cheap, low-quality materials and labour. This can result in poor service provision and potential safety issues if not overseen correctly.
Conclusion
Dublin Bus recorded an €18 million deficit for the year 2011 with an accumulated deficit of €48 million. Declining passenger numbers and a reduction in state subvention mean that cost reduction is necessary to bring operating costs in line with lower revenue. There appears to be two main options for lowering costs. One option is to continue cutting payroll and related costs. In recent years savings have been made by reducing the average number of employees. Average wages have remained stable over this period. An alternative option under consideration by the National Transport Authority is competitive tendering. It is likely that competitive tendering would bring cost savings. However this can be a very slow process and there is a danger that the quality of service may be compromised if the process is not managed effectively.
Notes:
1 Bus Eireann and Iarnrod Eireann also fall into the category of services which are “socially necessary but financially unviable”. As such, they also receive PSO payments.
2 Deloitte: “Cost and Efficiency Review of Dublin Bus and Bus Eireann”. January 2009.
3 From 2003-2011 payroll costs as a percentage of total operating costs have remained virtually unchanged at 67 percent. Source: Dublin Bus annual reports 2003-2011.
4 UBS Prices and Earnings, September 2012 edition.
5 “Competitive Tendering for Public Bus Services”, Richard G. Scurfield, World Bank
Tagged with:
Dublin Bus
About author
Related Articles
79 Merrion Square, Dublin 2, Ireland
tel: 353 (1) 676 0414 | email: info@publicpolicy.ie
Company registration number: 504956
Privacy Policy | Chairman's Blog | Events | Video | Public Policy Documents | News Property Tax Ireland | Pension Reform Ireland | Water Charges Ireland