
Domestic Water Use And Charges : Evidence From The USA
12 Nov 2014The amount of water Americans use at home varies considerably across the United States1 . Per capita domestic water use ranges from 51 gallons per day in Wisconsin to 168 gallons per day in Idaho, with Utah (167 gallons) and Arizona (147 gallons) close behind. Indeed, the highest rates of domestic water use per capita in the country are consistently found in the West.
These disparities can largely be attributed to landscaping; residents of drier states withdraw more water to maintain their lawns than do people in states with higher levels of rainfall. Indeed, domestic water use in the arid West is far higher than in most of the Midwest and East. Infrastructure also explains part of the variation. Old or damaged water pipes leak, which can unnecessarily increase domestic water use—nationally roughly 14 percent of treated water is lost due to leakage.
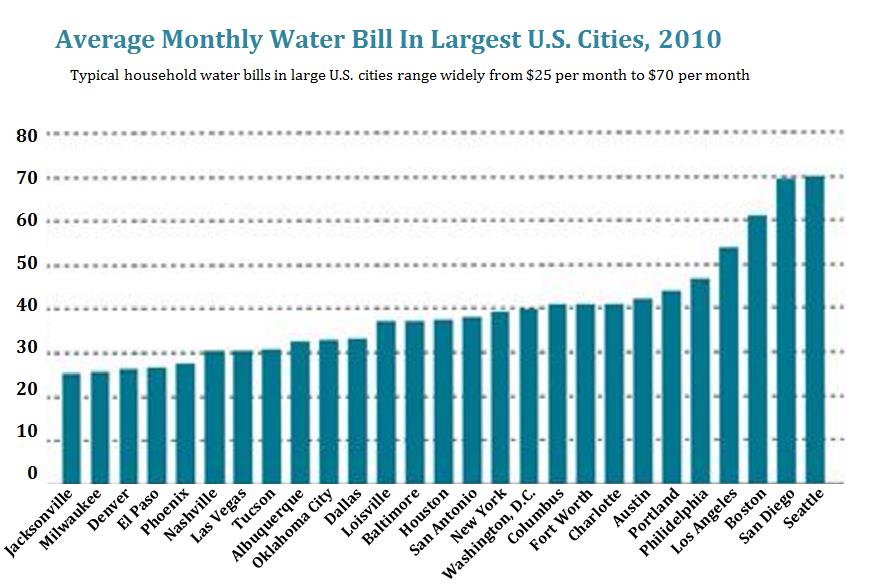
The price that households pay for water is highly variable across cities, even when controlling for the volume of water that different households use. Figure 1 shows average monthly water bills for households in large U.S. cities, assuming monthly consumption of 11,220 gallons, which is the typical usage for a family of four.
In Seattle, water costs $70 (€56) each month, or two and a half times the cost of water in Jacksonville or Milwaukee. Many cities in the West—such as Denver, El Paso, Phoenix, Las Vegas, Tucson, and Albuquerque, as shown in figure 1—have inexpensive water bills, but other dry cities, such as Los Angeles and San Diego, have among the highest water costs. Some of these differences are explained, in part, by provisions of the Clean Water Act that legally required certain older cities, including Boston and Seattle, to build new infrastructure—the costs of which are passed on to consumers through higher water bills. While many factors influence the price of household water, it is interesting to note that even cities in close proximity to one another may have considerably different water bills for the same volume of water. Philadelphia and Baltimore, for example, are less than one hundred miles apart, yet water systems in Philadelphia charge almost $10 (€8), or about 27 percent, more per month than water systems in Baltimore.
Many utilities also employ rate structures that change as water consumption changes. While some American cities (such as Nashville, Albuquerque, Oklahoma City, New York, Washington, DC, Portland, and Seattle) use uniform pricing structures, in which users are charged a constant rate for each gallon, many other cities (such as Phoenix, Dallas, and Los Angeles) employ increasing block rates that rise as consumption rises. Systems in some cities—such as Milwaukee, Baltimore, and Philadelphia—use decreasing block rates (where the cost of an additional gallon decreases as the total amount of water consumed increases), though this type of pricing structure is being phased out: from 1998 to 2010, the share of municipal systems using decreasing block rates fell from 35 percent to 19 percent.).
Figure 1. Average Monthly Water Bill in Largest U.S. Cities, 2010
Notes:
1 The source for this note is The Hamilton Project at the Brooking Institution
Tagged with:
Water Charges
About author
Related Articles
-
-
The Future Of Water Charges ?
15 Jun 2016 -

-

The New Water Charging Structure
3 Dec 2014
79 Merrion Square, Dublin 2, Ireland
tel: 353 (1) 676 0414 | email: info@publicpolicy.ie
Company registration number: 504956
Privacy Policy | Chairman's Blog | Events | Video | Public Policy Documents | News Property Tax Ireland | Pension Reform Ireland | Water Charges Ireland