

Commercial Rates And The Funding Of Local Authorities
9 Dec 2016Key Point
Income from commercial rates has increased by €137m (10%) between 2008 and 2015. This is in a period of little or no inflation. Rates income in 2015 was €1.5 billion, up from €1.4 billion in 2008. Reliance on commercial rates increased from 26% of revenue in 2008 to 37% in 2015. At least part of this increase is due to the reduction in Government grants arising from a transfer of functions, such as water services and third level support grants, from local authorities to other agencies.
Context
The levying and collection of rates are matters for each individual local authority. Rates are assessed on the valuation of immoveable property such as buildings, factories, and shops. The Annual Rate on Valuation (ARV), which is applied to the valuation of each property, to obtain the amount payable in rates, is decided by the elected members of each local authority in their annual budget.
Commercial Rates Revenue
Local authorities derive a significant proportion of their income from local sources such as commercial rates, and other goods and services such as housing rents, parking fees and environmental services. Revenue from commercial rates from 2008 to 2015 is shown below.
Table 1 – Commercial Rates Revenue €bn, 2008 – 2015
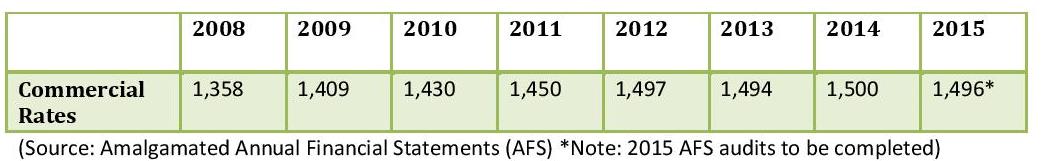
Commercial rates revenue has increased by 10.1% or €137m between 2008 and 2015. Revenue has remained stable at circa €1.5bn over the last five years. As a percentage of total revenue income, commercial rates have increased significantly in recent years. See table 2.
Table 2
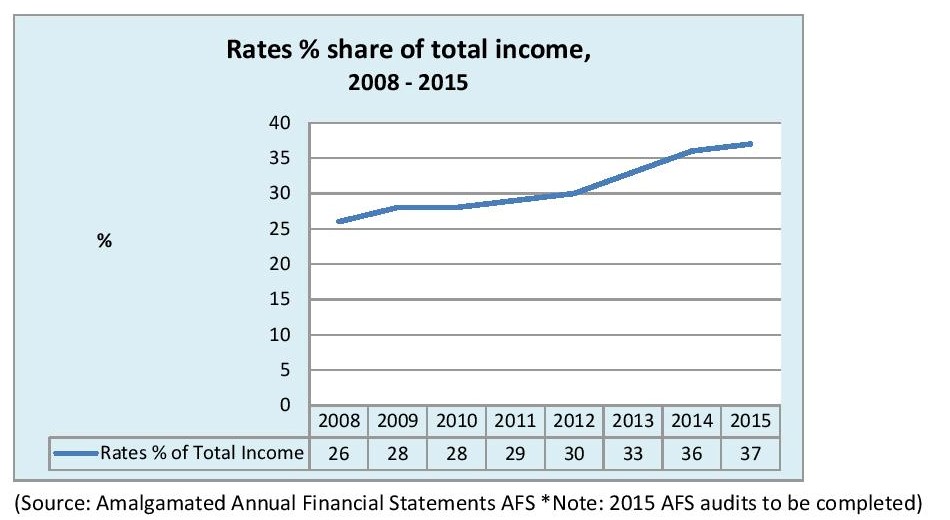
The increasing demand on commercial rates to fund local government can be partly attributed to a 62% decrease in income from central government grants and subsidies between 2008 and 2015.
Percentage of Total Revenue Income
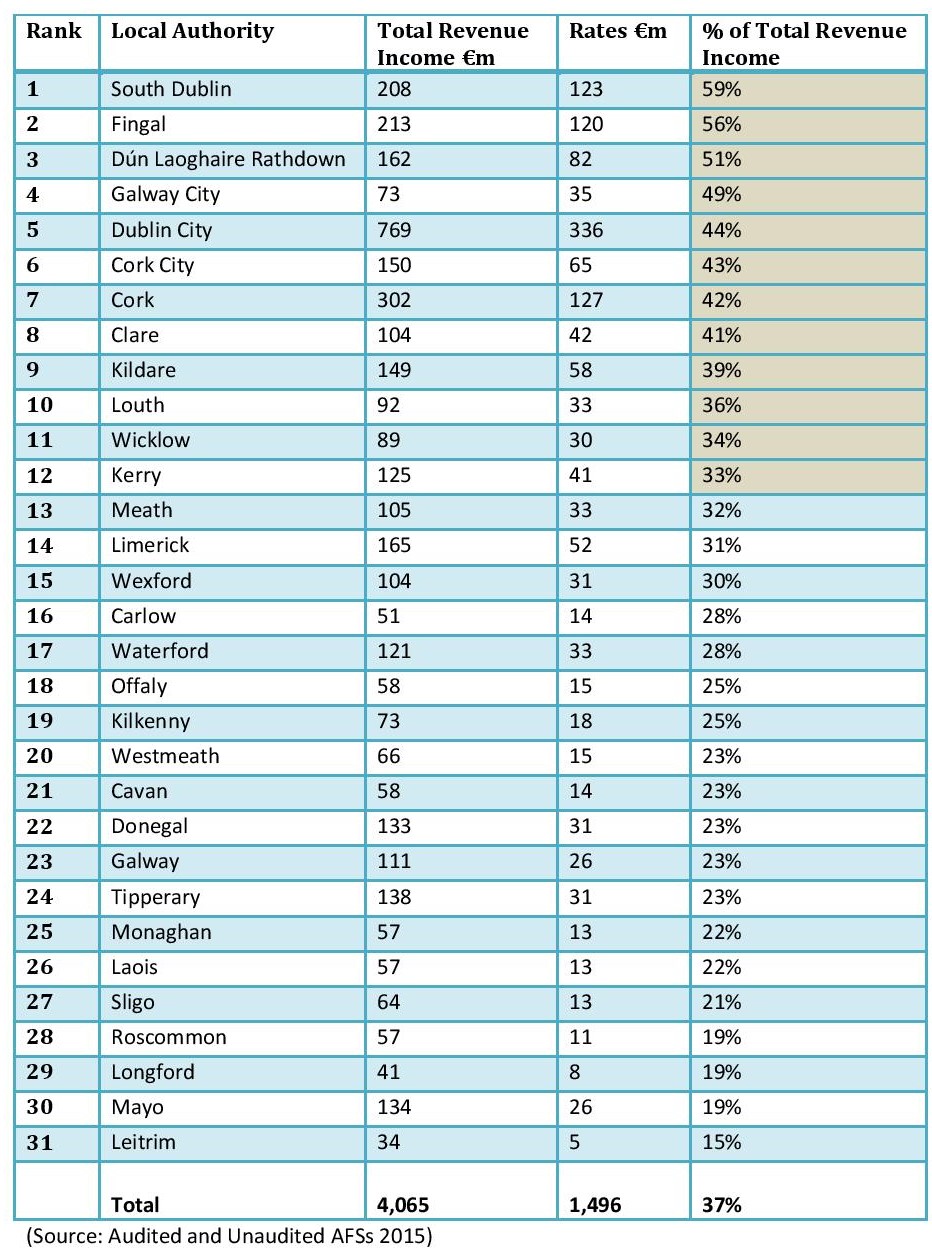
In 2015, commercial rates accounted for more than a third of total revenue income in twelve local authorities. South Dublin has the highest share at 59%, while Leitrim has the lowest at 15%. Table 3 ranks commercial rates revenue as a share of revenue income in all 31 local authorities.
Table 3 – Commercial Rates, % Share of Total Revenue Income in 2015
Tagged with:
Commercial Rates
About author
Related Articles
-
-

Commercial Rates
12 Sep 2017 -

Rates Revaluation
1 Mar 2017
79 Merrion Square, Dublin 2, Ireland
tel: 353 (1) 676 0414 | email: info@publicpolicy.ie
Company registration number: 504956
Privacy Policy | Chairman's Blog | Events | Video | Public Policy Documents | News Property Tax Ireland | Pension Reform Ireland | Water Charges Ireland