

Distribution Of Wealth In Ireland
1 Dec 2016Almost 60% of wealth in Ireland is owned by those over 55 and the largest components of tangible household wealth are the main residence and farms.
The Life Cycle Model
Much of the difference in wealth between households is due to their being at different stages of their lives. People typically save during their working lives, reach their peak wealth in the run-up to retirement and run down their assets in retirement. “This would create the appearance of substantial cross-sectional inequality of wealth even if there were no inheritances and everyone followed the same earnings trajectory over their lives”1
A clear life-cycle pattern emerges in Ireland when looking at the acquisition of one of the most significant assets for a household: their home. Homeownership is a particularly key asset in Ireland, as ownership rates are “ten percentage points higher in Ireland than the euro area average” .
The Life Cycle model has a number of phases; Accumulation, Consolidation and Spending.
Accumulation occurs early in life when individuals initially enter the work-force and for the first few years afterward.
Although they are finally earning money and have the capacity to begin saving, net worth is likely to be small. It may even be negative if there is debt, for example, from student loans.
During this phase, the priority may be to buy a home with a mortgage, starting a family. The scope for saving may be quite limited.2
Consolidation takes place during the mid-to-late stages of an individual’s career. Debt and other outgoings may be lower and there may be greater potential for saving in anticipation of a potential drop in income in retirement.
Spending commences at retirement as employment or business income ceases or slows. Debt should be repaid or much reduced, children no longer needing support, and costs (other than healthcare) lower.
Irish Wealth
Household net worth, calculated as the sum of housing and net financial assets was estimated by the Central Bank at € 626 billion, or € 135,078 per capita, at end-2015. Most of this was accounted for by housing assets at €429 billion. Irish household debt stood at €158 billion.
International Comparisons
The distribution of wealth in Ireland is significantly more equal than the European average. What is surprising is that it appears much more equal than in Denmark and Sweden which have an international reputation for egalitarianism. The data are in Table 1.
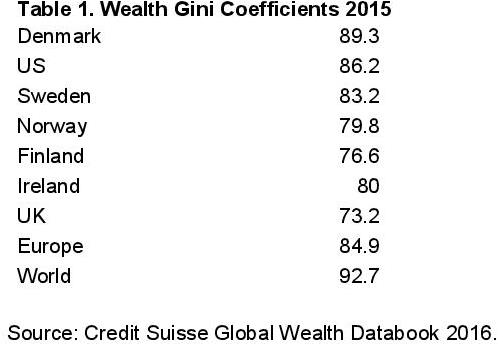
The ranking of wealth inequality by country can differ greatly relative to the same country’s ranking in relation to income inequality. This is due to the level of home ownership and other incentives to accumulate wealth in a given economy. Ireland’s level of wealth inequality is below the European average and this may reflect the high level of home ownership in Ireland.
In February 2015, the Central Statistics Office (CSO), in partnership with the Central Bank of Ireland and the European Central Bank, published the inaugural wave of the Household Finance and Consumption Survey (HFCS). Based on data from 2013, the HFCS tracks household-level data on assets, debt, consumption, and credit – providing the first update to Irish data on these topics since the late 1980s and a critical source of information for understanding the dynamics of the Irish economy and Irish households, post-recession.
“These results are consistent with a life-cycle model of saving in the presence of uncertainties where households borrow when younger and repay and save as they age”3 . (CB Economic Letter)
This study found that 58% of wealth is owned by those over 554. Irish households hold the great majority of their wealth in the form of real (non-financial) assets, with by far the largest components of household wealth being the main residence and farms5.
TILDA
Between 2009 and 2011, data were collected under the first wave of The Irish Longitudinal Study on Ageing (TILDA). Over 8,500 people aged 50 and over and living in Ireland were interviewed on a wide range of topics covering socioeconomic and health issues including holdings of wealth.
The Gini Coefficient in relation to wealth in the TILDA sample is 0.529 which is much greater than when looking at inequality in relation to income6 .
The level of home ownership by older people is 85% which is high relative to other countries7 . The level of ownership of financial assets is about 25%.
TILDA also collected information about levels of debt. The number of older people in debt is low and the amounts owed are generally low.
Pension Wealth
A major lacuna in the HFCS Survey is the omission of pension wealth. Total private sector pension savings at the end of 2015 amounted to €116 million. If we add (unfunded) pension rights of almost €100 billion in the public sector, total wealth in Ireland is in excess of €700 billion. This suggests that pension wealth is about 30 % of total wealth8.
In July 2012 to June 2014 private pension wealth and net property wealth together accounted for over three quarters of aggregate total wealth of all private households in Great Britain (40% and 35% respectively) with financial wealth accounting for just 14% and physical wealth just 10%9 . These proportions have changed over time with private pension wealth accounting for a higher proportion of aggregate total wealth (34%) in July 2006 to June 2008 (the earliest period for which data are available) and property wealth a smaller proportion (42%) in July 2006 to June 2008. Physical and financial wealth have shown much less change.
Clearly the data on pension wealth is on a pre-tax basis, but pre-tax values include an implicit tax liability and may not provide a complete measure of the financial position of the holder when compared with wealth held in other forms.
Capital Income
An indication of the distribution of financial wealth is provided by a study of Revenue Commissioners data for 2012 10. Capital income accounts for around 10 per cent of total market income for deciles 1 to 9 and only becomes significant for the top decile (21.8 per cent of their gross income). The share increases to 40.9 per cent and 54 per cent at the top 1 per cent and 0.1 per cent, respectively.
When we examine the distribution of capital income, the Revenue data show that in 2012, 58.1 per cent of capital income went to the top decile, 31 per cent went to the top 1 per cent and 12.9 per cent went to the top 0.1 per cent.
Human Capital
An important component of wealth is human capital which may be defined as the abilities and skills of individuals especially those acquired through investment in education and training that enhance potential future earnings. Most estimates of wealth omit to include any value for human capital.
As noted above, most wealth is in the hands of those aged over 55. However, the human capital of younger people in Ireland is significantly greater than older age groups. Table 2 shows the educational attainment of the 25-34 and the 55-64 age groups in Ireland in 2015.
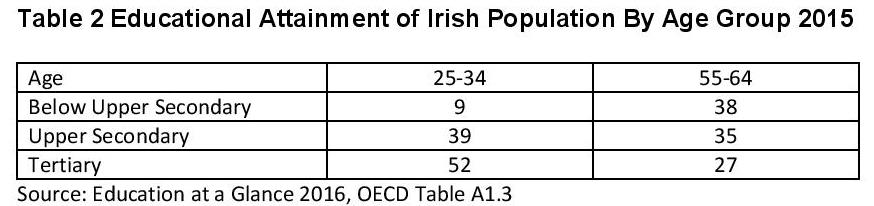
The improvement in educational attainment is dramatic. Over 4 times as many in the older age group had below upper secondary education while almost twice as many in the younger are group had a tertiary qualification.
Therefore while the younger age group may own a relatively small percentage of total wealth as conventionally measured, they benefit from much higher levels of human capital than older age groups.
Inheritances
“It is large inheritances … which perpetuate inequality”11
We have no data on the contribution of gifts and inheritances to wealth inequality in Ireland. Crawford and Hood12 find based on English data that those with higher levels of education and higher levels of household income are both more likely to receive an inheritance, and on average receive a larger inheritance.
They find that the definition of wealth used is very important when assessing the contribution of intergenerational transfers to wealth inequality. A common feature of all previous papers on the subject is that they focus on the distribution of current ‘marketable’ wealth, with non-fungible assets such as physical wealth and future public and private pension rights typically excluded. In line with this literature, they find that, on this definition, inheritances and gifts reduce wealth inequality. This is because while inheritances are smaller in absolute terms for those lower down the wealth distribution, they are more important relative to other wealth holdings, and hence reduce inequality on a relative measure.
Including pension wealth significantly reduces inequality in the distribution of wealth excluding transfers, as pensions (and public pensions in particular) account for a larger share of wealth towards the bottom of the distribution. This has the effect of shrinking (or even eliminating) the inequality-reducing impact of inheritances found in the previous literature, as this result was driven by the very large proportional increase in wealth at the bottom of the distribution when transfers are included.
We have very little published data on gifts and inheritances in Ireland other than very limited information on the yield of capital acquisitions tax by the Revenue Commissioners13.
Conclusions and Recommendations
The Life Cycle model suggests that people need to accumulate capital during their working lives to finance their old age. After housing, the next most important form of wealth is pension rights. However wealth in this form is unequally distributed.
According to CSO data14 in Quarter 4 2015 just under half (47%) of all workers aged between 20 and 69 years had a pension (occupational pension, personal pension or both). Pension coverage remained lowest among the youngest workers. 14.1% of workers aged 20-24 years had a pension while just over one third (36%) of workers aged 25 to 34 years reported having a pension. Pension coverage was greatest among workers aged 35-44 years where total pension coverage was 55.3%. Of those with pension cover, 73% of workers aged between 20 and 69 years had an occupational pension.
There is an urgent need to increase pension coverage. We recommend the introduction of a system of auto-enrolment into a National Pension Fund on the lines recommended here 15. International experience shows that auto-enrolment would boost significantly both pension membership and pension saving16.
To gain a fuller understanding of the impact of gifts and inheritances on the distribution of wealth, we recommend that the Revenue Commissioners publish significantly more data based on returns for capital acquisitions tax.
___________________________________
Notes:
1 Tax by Design : the Mirrlees Review, Institute for Fiscal Studies p 350
2 31 % of households where the age of the reference person was under 35 were classed as credit constrained. Table 10 of Household Consumption and Finance Survey, CSO 2015.
3 Household Saving Behaviour in Ireland, Julia LeBlanc, Central Bank Economic Letter, Vol 2016, No 5.
4 Household Finance and Consumption Survey 2013, CSO5 Lawless, M and Lynch, D, Scenarios and Distributional Implications of a Household Wealth Tax in Ireland, ESRI Working Paper no 549, November, 2016
6 O’Sullivan, V., Barrett, A. and Nolan, B. (2013) Income and Wealth in The Irish Longitudinal Study on Ageing. IZA Discussion Paper No. 7393, IZA, Bonn
7 http://tilda.tcd.ie/publications/reports/w2-key-findings-report/Wave%202%20Key%20Findings%20Report.pdf
8 This excludes the value of accumulated rights to the State Pension.
9 Wealth in Great Britain Wave 4 2012 to 2014 Office of National Statistics
10 Kennedy, S. et al. (2015), “Taxes, income and economic mobility in Ireland: New evidence from tax records data”, OECD Economics Department Working Papers, No. 1269, OECD Publishing, Paris
11 Sandford, C “Death Duties : Taxing Estates or Inheritances”. Fiscal Studies Vol 8 , Pages 15-23 , 1987
12 Lifetime Receipt of Inheritances and the Distribution of Wealth in England, Rowena Crawford and Andrew Hood, Fiscal Studies Vol37. No 1 March, 2016
13 http://www.revenue.ie/en/about/statistics/receipts-capital-acquisitions-tax.html
14 http://www.cso.ie/en/releasesandpublications/er/q-penp/qnhsmoduleonpensionsq42015/
15http://www.publicpolicy.ie/wp-content/uploads/de-Buitleir-and-Thornhill-Kenmare-Paper-2011-Final.pdf
16 https://www.ifs.org.uk/uploads/publications/research%20summaries/auto_enrolment_1116.pdf
About author
79 Merrion Square, Dublin 2, Ireland
tel: 353 (1) 676 0414 | email: info@publicpolicy.ie
Company registration number: 504956
Privacy Policy | Chairman's Blog | Events | Video | Public Policy Documents | News Property Tax Ireland | Pension Reform Ireland | Water Charges Ireland