
Social Benefits In Ireland
16 Dec 2015Introduction
Social Protection payments were the largest component of Government spending in 2014, totalling €19.8 billion. The ‘Survey of the Benefit System in Ireland’ provides key information on social payments, such as recipient numbers and expenditure on different programmes. You can read the full Survey here. Over 50 different schemes are outlined, and comparisons in spending between 2014 (the latest year available) and 2013 are detailed.
Social Protection System
The Department of Social Protection (DSP) spent €19.8 billion on schemes, services and administration in 2014, a decrease of 2.2 percent compared to 2013 (€20.3 billion).
Table 1 shows social welfare expenditure since 2008.
Table 1
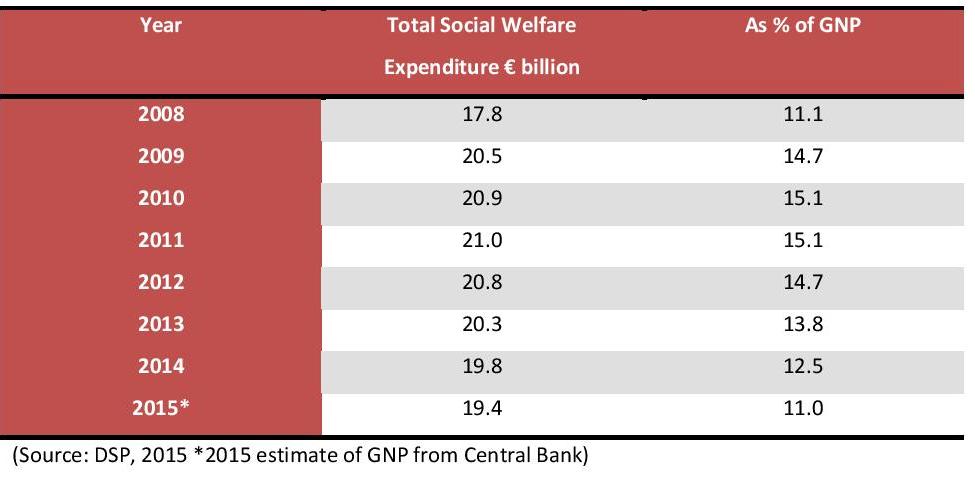
Total expenditure on social protection is estimated to reach €19.4 billion in 2015.
The total number of recipients of weekly social welfare payments in 2014 was 1.44 million. This is a reduction of 1.8 percent over 2013. When qualified adults and children are included, there were 2.22 million beneficiaries in 2014 (a decrease of 2.3%); 48.2 percent of the population were beneficiaries of social payments in 2014.
Figure 1 shows the number of recipients and beneficiaries from 2004 to 2014. One can see the sharp increase from 2008/2009 to 2011. However, between 2013 and 2014 recipient numbers decreased by 27,042 (a drop of 1.8 percent), while beneficiaries numbers decreased by 53,341 (a drop of 2.3 percent).
Figure 1 – Beneficiaries and Recipients 2004 – 2014
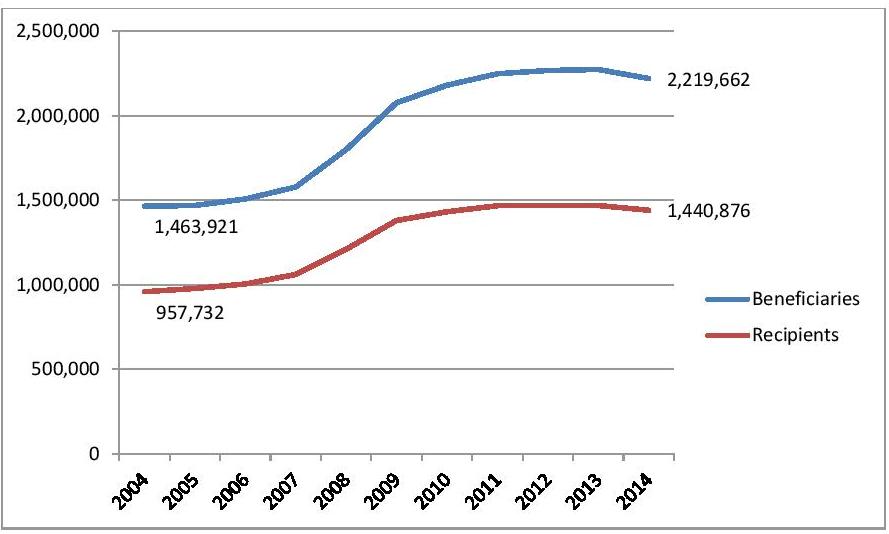
(Source: DSP, 2015)
The reduction in unemployment is contributing to the fall in recipient numbers, which has also contributed to the fall in total social welfare expenditure between 2013 and 2014. The seasonally adjusted unemployment rate as of November 2015 was 8.9 percent.
Payments by Group
The payments of the DSP go to three main groups of people (or programmes); children, people of working age, and retired and older people. Full details on all schemes may be accessed here. Figure 2 below shows the percentage of DSP spending that goes to each of these three cohorts.
Figure 2 – Expenditure by recipient type as % of DSP total expenditure
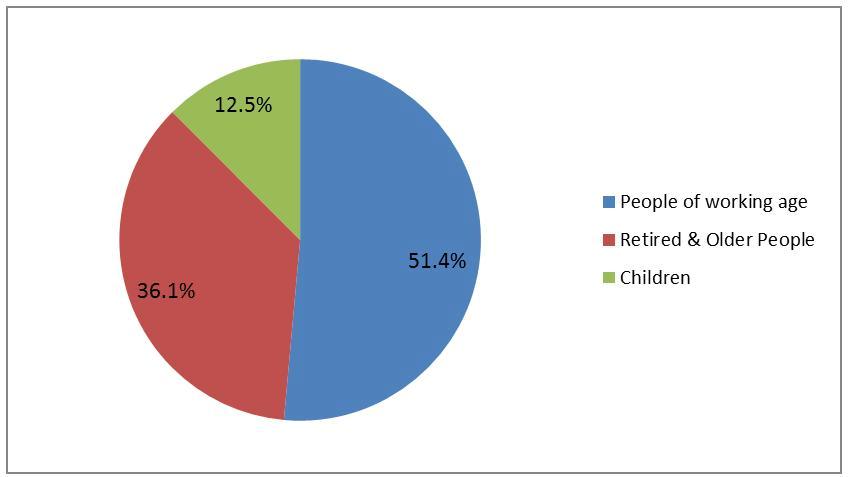
(Source: DSP (2015)
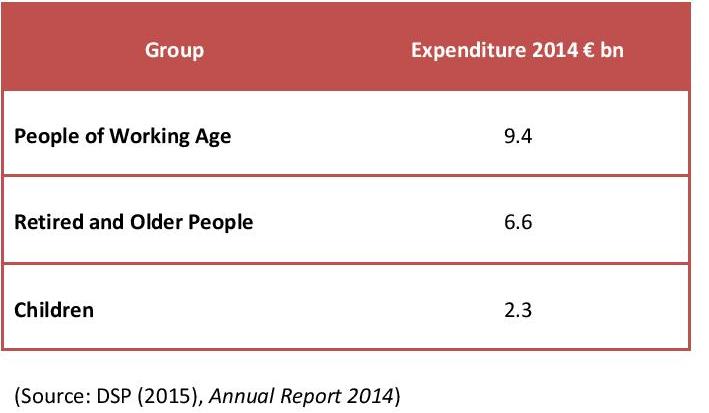
The largest proportion of expenditure (51.4%) goes towards people of working age, followed by retired and older people (36.1%), and children (12.5%). Table 2 shows the expenditure amounts in 2014 on these three cohorts.
Table 2 – Expenditure by Group in 2014
About author
79 Merrion Square, Dublin 2, Ireland
tel: 353 (1) 676 0414 | email: info@publicpolicy.ie
Company registration number: 504956
Privacy Policy | Chairman's Blog | Events | Video | Public Policy Documents | News Property Tax Ireland | Pension Reform Ireland | Water Charges Ireland