
How Has Crisis And Austerity Changed The Shape Of Public Expenditure?
27 Nov 2014Budget 2015 brought to an end six years of fiscal contraction. Savings in the region of €29 billion have been made over 8 austerity Budgets, over €18 billion of which was as the result of cuts in net expenditure. However, spending cuts were not applied proportionately to all areas of public expenditure. In addition, the economic crisis put upward cost pressure on welfare programmes and on debt servicing costs. As a result of both discretionary policy decisions and non-discretionary increases in demand for public services, the shape of public expenditure has changed significantly. This note examines this change by comparing pre-crisis Voted expenditure in 2007 to spending estimates for 2014. The evidence shows that current spending on “frontline” services has been relatively protected compared to cuts in capital spending and support services.
The Size of Government Expenditure
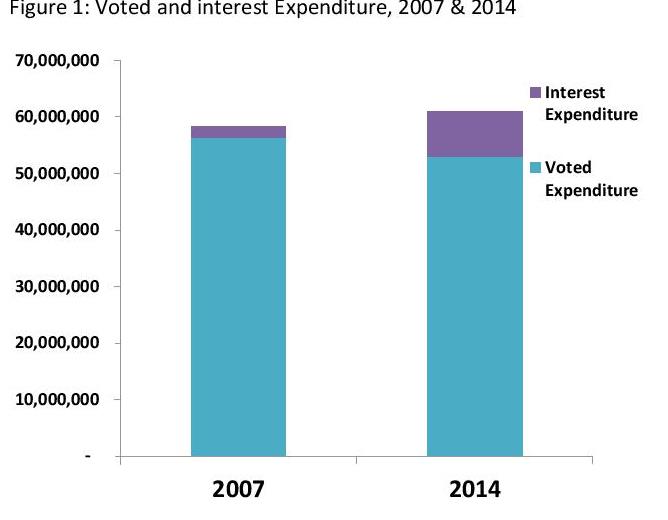
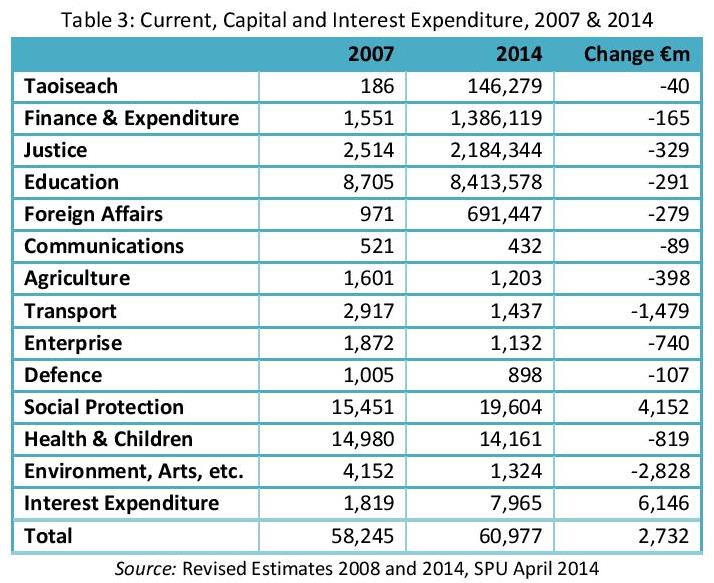
Total departmental gross expenditure is estimated to amount to €53 billion this year, compared to €56.4 billion in 2007, a fall of €3.4 billion. While this may look relatively small given compared to the €18 billion in spending cuts mentioned above, the two figures are not directly comparable1 . Spending cuts are valued ex-ante in a static manner, whereas the ex-post decrease in expenditure occurs alongside the dynamics of the real world, including increasing demand for public services. Indeed, excluding Social Protection, which is the area that has seen the biggest increase in demand, spending in the other Departments fell by €7.6 billion. Looking solely at voted expenditure excludes the rapid rise in the cost of servicing the national debt, which is one of the most significant developments affecting the public finances over this period. National debt interest expenditure rose from €1.8 billion in 2007 to nearly €8 billion this year – a result of both the bank bailout and cumulative large deficits. Combined voted and interest expenditure therefore increased from €58.2 billion in 2007 to €61 billion in 2014.
Capital Punished
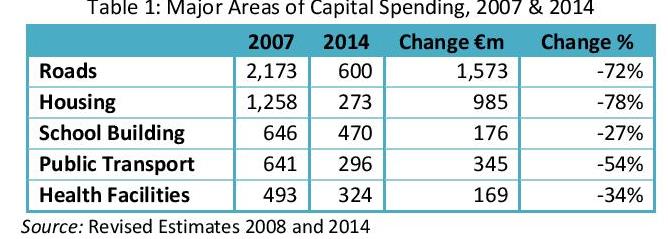
When expenditure is divided up into current and capital spending components, it is apparent that in both relative and real terms, capital expenditure has borne the brunt of austerity’s impact. Capital expenditure fell by €4.5 billion, or 57%, between 2007 and 2014, while gross current expenditure actually rose by €1.1 billion (2%) over the same period – although this increase was entirely due to non-discretionary spending increases in Social Protection. Excluding Social Protection, current expenditure fell by €3.1 billion (9%). There are a number of caveats that should be kept in mind when interpreting the reduction in capital expenditure since 2007. The first is that with the completion of the motorway programme, capital spending was likely to be scaled back anyway. Secondly, Public/Private Partnerships are kept “off-books”, and so are omitted in the above analysis. Also kept “off-books” is investment in water infrastructure for 2014, which is now under the purview of Irish Water. On a broader note, using 2007 as a base year for comparison does not imply that the spending patterns observed in that year are in some way correct, and that subsequent deviations therefore represent an undesirable reallocation of resources. With capital spending in particular, expenditure in 2007 was aimed at building capacity for an economy that would have been significantly larger than it is today. Nevertheless, the reduction in the largest areas of capital expenditure has been quite striking, as can been seen in Table 1.
Shifting Currents
Comparing patterns of current expenditure before and after the crisis is impeded somewhat by the reorganisation of Departments and functions that occurred in the aftermath of the 2011 election. In order to ensure the comparability of spending across both time periods, the 2014 data is presented to better match the institutional set-up in 2007. Further detail is provided in the annex. Table 2 shows how current expenditure has changed since the height of the bubble. While total current expenditure rose by €1.1 billion, this can be attributed to increased demand for social welfare, which pushed up spending in Social Protection by €4.1 billion. While much of the pressure on the social welfare system came as a result of the decimation of the workforce, population demographics have also played a role – the number of people in receipt of state pensions (Contributory, Non-Contributory and Transition) has risen by over 100,000 since 2007, and spending on these schemes has risen by over €1.6 billion. The only other area that saw spending rise over the period was Finance.
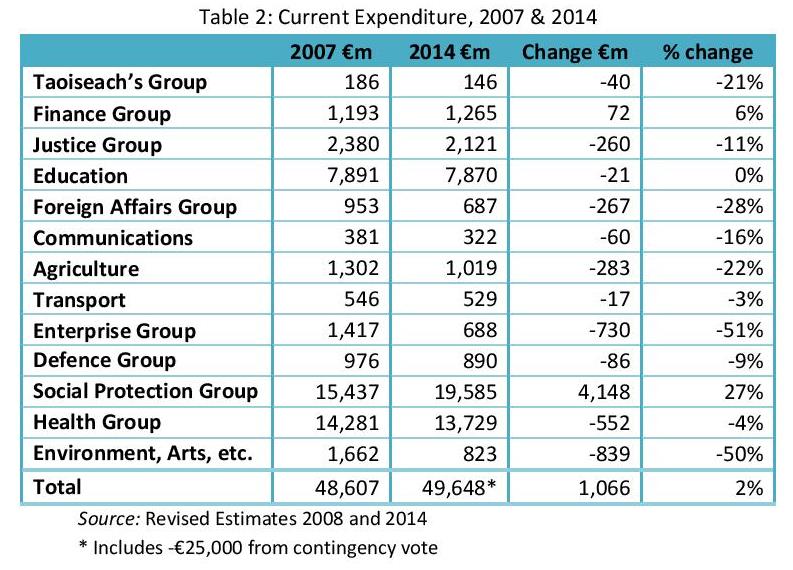
Examining the change in spending in Table 2 reveals a pattern of relatively smaller decreases in “front-line” areas of expenditure such as Education and Health (although decreases in these areas mask demographic pressures that have increased demand) while other services have been harder hit, including areas such as Enterprise and the lose amalgam of societal supports Environment, Arts, etc. As a result of these changes, spending on Social Protection has increased markedly as a proportion of overall current expenditure. The share going to all other categories of expenditure has thus fallen, but the decrease has been particularly acute in areas outside of health, education, security, and state administration.
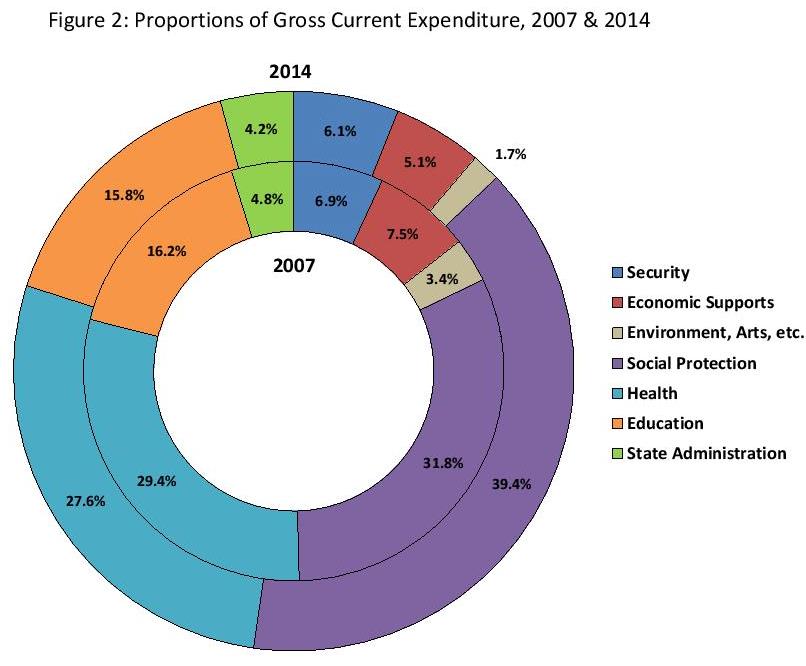
Source: Revised Estimates 2008 and 2014
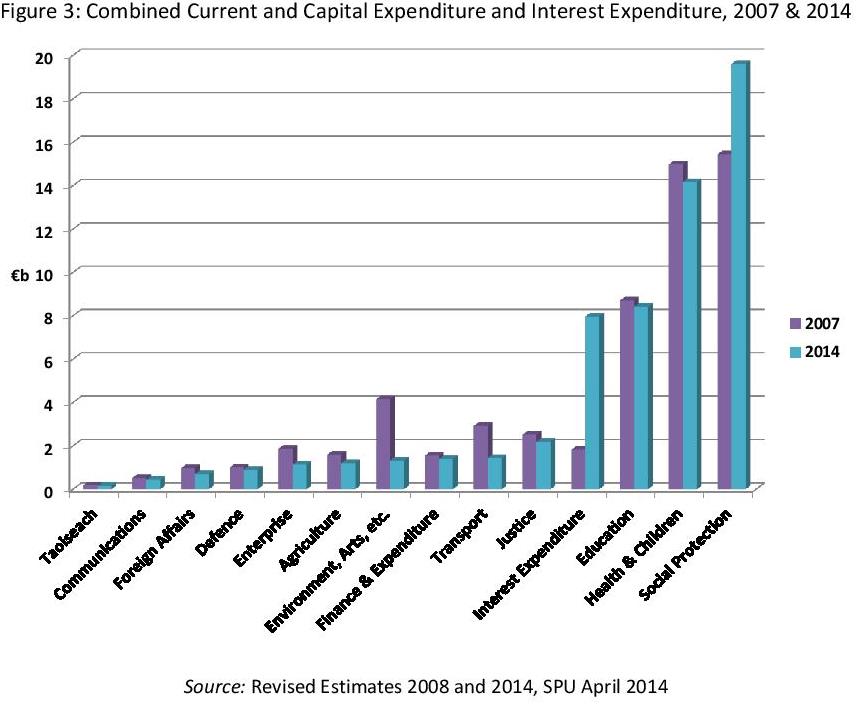
Combined capital and current expenditure are presented below. As well as the aforementioned increases in interest expenditure and spending on social welfare, large decreases are observed in Environment, Arts etc., Transport, Enterprise and Health.
Annex: Spending Categories
When the current government took office in 2011 a number of changes were made to the institutional framework, which complicates comparisons of voted expenditure. In order to provide a more accurate comparison, 2014 expenditure has been reallocated to provide a better – albeit somewhat crude – comparison with 2007. 2011 saw the creation of two new Departments, with the Department of Public Expenditure & Reform being carved out of the Department of Finance and the Department of Children & Youth Affairs becoming independent of the Department of Health. These Departments were re-combined in this analysis in order to allow comparisons with 2007. Other significant changes were the movement of the Skills programme (including Fás/Solas) from the Department of Enterprise to the Department of Education and the addition to the Transport portfolio of the Sports and Tourism programmes. There were further changes to some of the smaller portfolios, which have been amalgamated to form the catchall Environment, Arts etc. This area includes the Environment, Local Government, Art, Heritage, Community & Rural, Gaeltacht, Sport and Tourism programmes. In Figure 2, Defence and Justice are combined under Security, the Departments of the Taoiseach, Finance (including Expenditure & Reform) and Foreign Affairs form State Administration, and Economic Supports covers Enterprise (including Skills), Agriculture, Transport and Communications.
Notes:
1 Not least because the €18 billion figure is based on cuts to net expenditure, which includes increases in charges for Departmental services as well as actual spending cuts. Figures are not available for how much was accounted for by gross expenditure cuts.
About author
79 Merrion Square, Dublin 2, Ireland
tel: 353 (1) 676 0414 | email: info@publicpolicy.ie
Company registration number: 504956
Privacy Policy | Chairman's Blog | Events | Video | Public Policy Documents | News Property Tax Ireland | Pension Reform Ireland | Water Charges Ireland