
Deprivation
8 Jul 2015Key Point
This note examines deprivation trends since 2008 as measured by the SILC1 . Deprivation rates have increased significantly reflecting the impact of the economic crisis. Deprivation rates have now reached very high levels in one-parent households, those living in rental accommodation (at below market rent or rent free), and the unemployed.
How is Deprivation measured?
The SILC measures deprivation by asking survey respondents if they have experienced any of the following eleven types of enforced deprivation. If respondents identify themselves as having experienced two or more of the items, the SILC categorises them as having experienced deprivation.
The eleven indicators which measure deprivation are:
1. Two pairs of strong shoes
2. A warm waterproof overcoat
3. Buy new (not second‐hand) clothes
4. Eat meal with meat, chicken, fish (or vegetarian equivalent) every second day
5. Have a roast joint or its equivalent once a week
6. Had to go without heating during the last year through lack of money
7. Keep the home adequately warm
8. Buy presents for family or friends at least once a year
9. Replace any worn out furniture
10. Have family or friends for a drink or meal once a month
11. Have a morning, afternoon or evening out in the last fortnight for entertainment
In 2013, the most common types of deprivation experienced were shared across both those at risk of poverty2 and those not at risk of poverty. Figure 1 below shows the most common deprivation types and rates in 2013 among these categories, and overall.
Figure 1 – Deprivation Rates and Types 2013
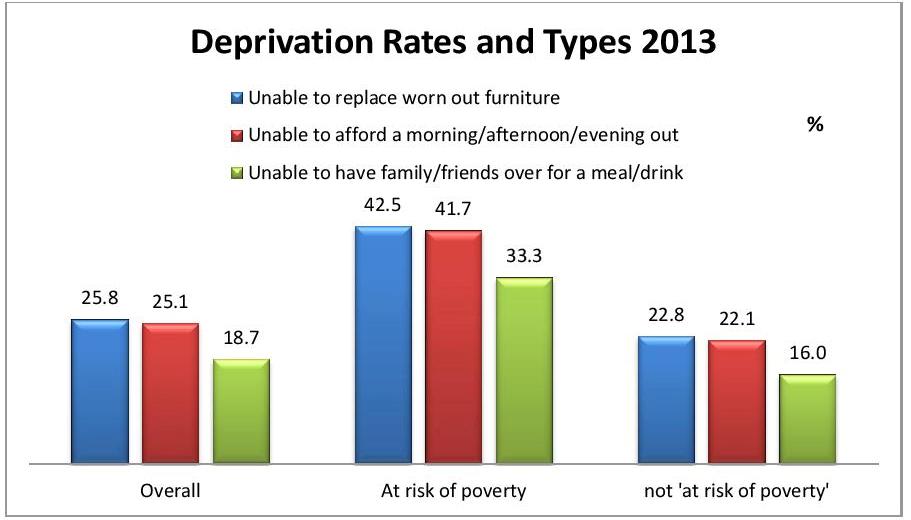
(Source: SILC 2013)
A quarter of those surveyed (25.8%) stated that they were unable to replace worn out furniture. Likewise, a quarter of the population (25.1%) were unable to afford a morning/afternoon/evening out in the last fortnight. The percentage deprivation rates for those at risk of poverty are on average 16% higher than the overall figures, while the rates are on average 2.9% lower among those not at risk of poverty.
Deprivation by Age
The age profile of the population who are deprived is noteworthy. Table 1 below shows the deprivation rate experienced by three different age cohorts: namely 0-17 years, 18 to 64 years, and 65+ years. Deprivation rates are shown over the period 2008 to 2013
Table 1 – Percentage Deprivation by Age Group (2 or more types of deprivation experienced)
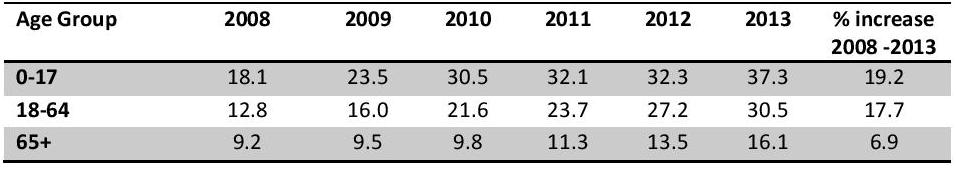
(Source: SILC)
The youngest age group (0-17 years) has the highest deprivation rate, at 37.3% in 2013. Deprivation among this group has increased significantly between 2008 and 2013, with an increase of 19.2 percentage points – almost one-fifth of the age group. Likewise, deprivation amongst the core working-age group of 18-64 year olds has more than doubled over the period, peaking at 30.5% in 2013.
The 65+ age group has also experienced an increase in deprivation. However, those over 65 have the lowest deprivation rate of the three age groups. The 0-17 age group had more than twice as many people (37.3%) having experienced enforced deprivation than those in the 65+ age group (16.1%) in 2013.
Deprivation by Household Composition/Economic Status
The deprivation rate peaked in 2013 with 30.5% of those surveyed experiencing enforced deprivation. This rate has more than doubled since 2008, when it stood at 13.7%.
• Those living in households where there was one adult and one or more children (lone parents) had the highest deprivation rate in 2013 at 63.2%.
• The second highest deprivation rate was among those in accommodation that was rented at below the market rent or rent free (56.6%).
• The third highest deprivation was found among individuals who described themselves as unemployed (54.9%).
The lowest deprivation rate in terms of the principal economic status of the head of household was found in the retired group (15.8%).
Deprivation by Income Decile
Figure 2 below shows the changes in the deprivation levels experienced between the ten different income deciles. Deprivation has increased across all deciles, with the largest increases in the bottom half of the income distribution.
Figure 2 – Deprivation by Income Decile 2008 and 2013
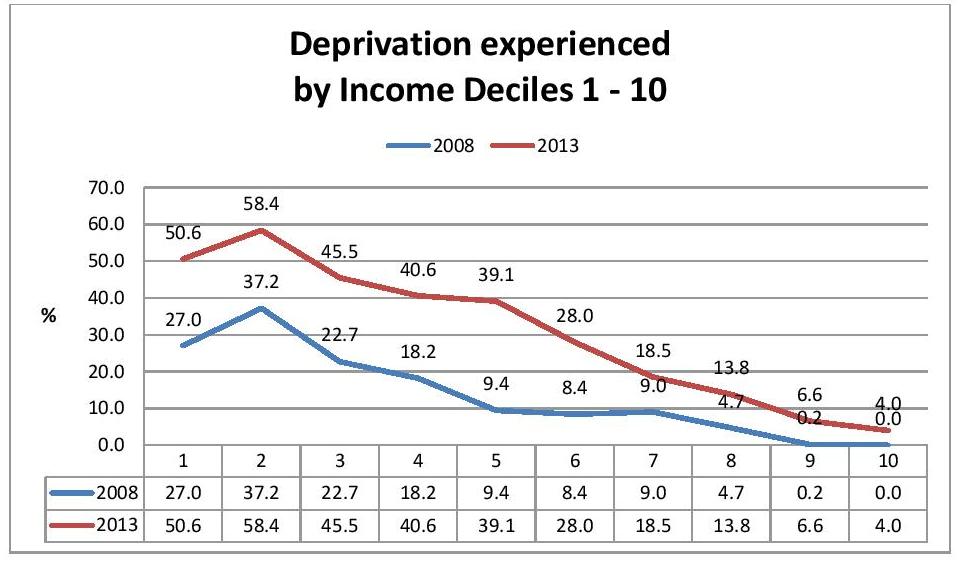
(Source: SILC)
Conclusion
Deprivation rates have increased across the Irish population. Deprivation has increased most among those in the lower and middle income deciles since 2008. The younger age group (0-17 years) have a significantly higher likelihood (37.3%) of experiencing deprivation in contrast to those aged over 65 years (16.1%). Lone parents had the highest deprivation rate (63.2%) in 2013.
Notes:
1 The Survey on Income and Living Conditions (SILC) is an annual survey which commenced in Ireland in 2003. The most recent SILC data relates to 2013.
2 The ‘at risk of poverty’ category is defined as those whose income is less than 60 percent of the median disposable income threshold.
About author
79 Merrion Square, Dublin 2, Ireland
tel: 353 (1) 676 0414 | email: info@publicpolicy.ie
Company registration number: 504956
Privacy Policy | Chairman's Blog | Events | Video | Public Policy Documents | News Property Tax Ireland | Pension Reform Ireland | Water Charges Ireland