

Underemployed Part-time Workers
23 Mar 2018Key Point
Employment increased by almost 70,000 (3.1%) in the year to Q4 2017. Over 115,000 part-time workers would like to work more than they currently do.
More Full-time Jobs than Part-time Jobs
The number of people employed in Q4 2017 reached 2.23 million. Table 1 shows key employment figures for Q4 2017 relative to Q4 2016 from the new Labour Force Survey (LFS) produced by the CSO1 .
Table 1 – Persons aged 15 and over by Employment Status, Q4 2016 and Q4 2017 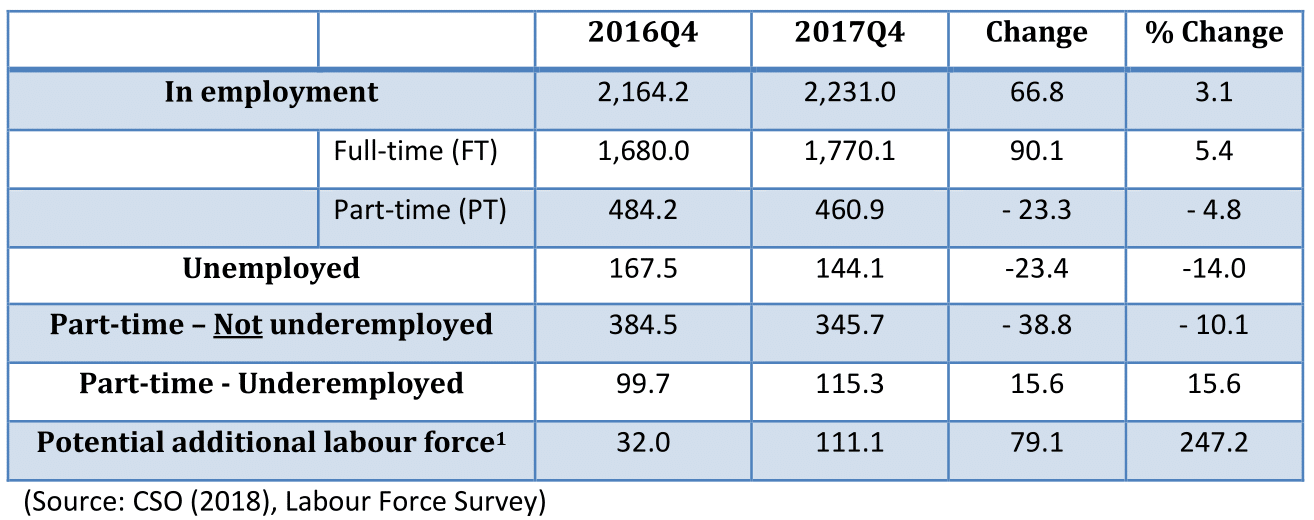
Table 1 shows that the numbers in employment increased by 66,800 (3.1%) in the twelve months to Q4 2017. Full-time employment increased by 90,100 (5.4%), while part-time (PT) employment decreased by 23,300 (-4.8%) over this period. The number of people unemployed decreased by 23,400 (-14%) in the year to Q4 2017 to stand at 144,100. Of those in employment, the share of full-time workers has increased from 77.6% in 2016 to 79.3% in 2017. Conversely, the share of part-time workers has decreased from 22.4% to 20.7% over the same period.
Involuntary Part-time Workers
The number of those working part-time decreased to 460,900 (down 23,300 or 4.8%) in Q4 2017. There were 115,300 part-time underemployed workers in Q4 2017. As a share of those employed part-time, PT workers who are underemployed increased from 20.6% in Q4 2016 to 25% in Q4 2017. As a share of all employment, the same workers have increased from 4.6% of those employed to 5.2% of those employed. Figure 1 shows the trend in the share of PT underemployed workers relative to all PT employment and all employment.
Figure 1 – Part-time Underemployed, 2008 – 2017
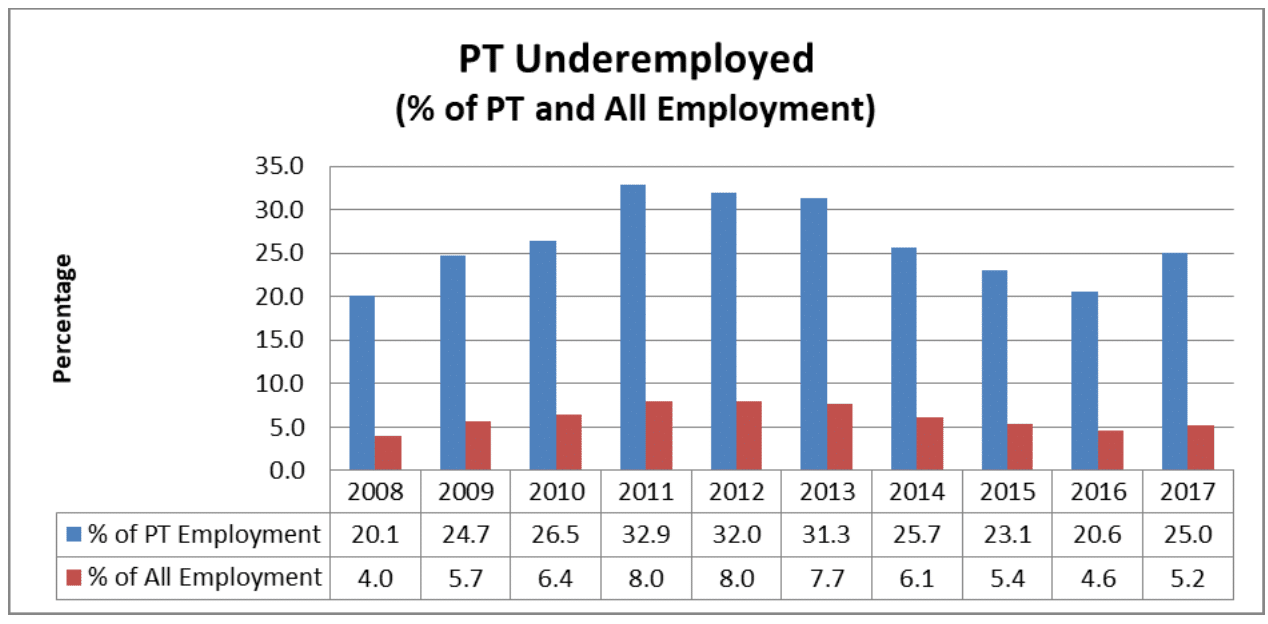
(Source: CSO (2018), Labour Force Survey)
Figure 1 shows the percentage of PT underemployed workers as a share of all PT workers peaked in 2011 at one-third (32.9%) and then fell by over 12 percentage points to 20.6% in 2016. Under the Labour Force Survey, it has increased to one-in-four PT workers as of the end of 20173 .
Gender Profile of Involuntary Part-time Workers
Females accounted for 70% of PT workers in Q4 2017 (321,600). Three-in-five (60%) of underemployed PT workers are female (69,000). The European Commission in its 2018 country report on Ireland noted that the employment rate of women remained below the EU average in 2016, at 64.2%, with many moving into inactivity or part-time work because of caring responsibilities.
______________________________
Notes:
1 The Labour Force Survey (LFS) commenced from Q3 2017 and it replaces the Quarterly National Household Survey (QNHS).
2 The Potential Additional Labour Force (PALF) is the sum of the two groups ‘persons seeking work but not immediately available’ and ‘persons available for work but not seeking’.
3 Due to the change to the LFS, there are changes in the levels of some series from Q3 2017 onwards. As a consequence, the series before and after the introduction of the new survey may not be directly comparable and readers should therefore note this when examining annual and quarterly changes.
About author
79 Merrion Square, Dublin 2, Ireland
tel: 353 (1) 676 0414 | email: info@publicpolicy.ie
Company registration number: 504956
Privacy Policy | Chairman's Blog | Events | Video | Public Policy Documents | News Property Tax Ireland | Pension Reform Ireland | Water Charges Ireland