
The Making of ‘Where Does Your Tax Go?’
10 Oct 2013This blog post explains the process behind the creation of our government expenditure app Where Does Your Tax Go? Any further questions or comments are welcome, either in the comments section or via info@publicpolicy.ie. Data available in excel form on request.
Background
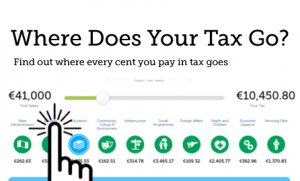
Where Does Your Tax Go? Is an interactive web-based tool aimed at highlighting the link between the taxes we all pay and the services they go towards providing. Users select how much tax they pay yearly via a slider, and this amount is then divided up between the different functions of government. The user can further explore each function to discover how their money is spent, down to the last cent.
The design of Where Does Your Tax Go? is based on a similar tool by the UK’s Open Knowledge Foundation called The Daily Bread. Those interested in the transparency and visibility of government data are encouraged to explore the wider work of the Open Knowledge Foundation, which is aimed at connecting citizens with their governments.
In building Where Does Your Tax Go?, one main simplifying assumption was made: all government revenues go into one large pot, and all expenditures come out of this same pot. For the most part, this assumption holds true. There are however some exceptions, two of which I will highlight:
- First, PRSI receipts are paid directly into the Social Insurance Fund, and it is from this fund that certain benefits are paid. The Social Insurance Fund is currently running a deficit (spending on benefits exceeds revenue from PRSI receipts) so that it must be topped up with general tax revenue.
- Second, public service broadcasting is funded via the TV Licence Fee. I made the decision to include this item of expenditure in order to allow for comparisons to be made with other areas in terms of the amount of expenditure involved, even though it is not directly funded by general taxation.
This simplifying assumption means that Where Does Your Tax Go? describes a hypothetical world where taxes are not earmarked for particular areas of expenditure.
Expenditures
Where Does Your Tax Go? divides government expenditure into 10 different functions:
• State Administration
• Security
• Education
• Community, Culture and Environment
• Infrastructure
• Social Programmes
• Foreign Affairs
• Health and Children
• Economic Supports
• Servicing Debts
These are then divided into 97 sub-functions. This of course is only one of several ways of dividing expenditure – alternatives include division by Department, or by pay/non-pay elements. The choice of how to divided expenditure is somewhat subjective, and Where Does Your Tax Go? merely represents my own preference.
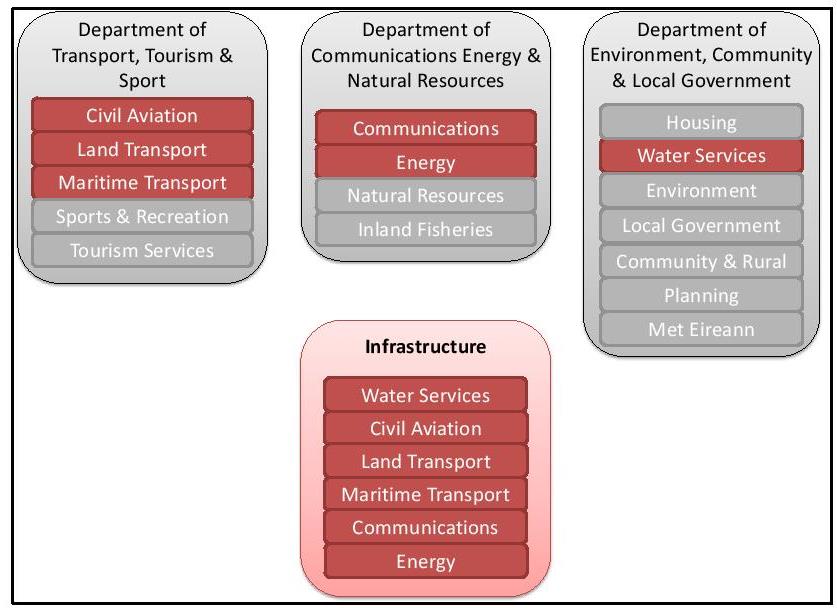
Most of the expenditure data comes from the 2013 Revised Estimates for Public Expenditure. The Revised Estimates provide data by vote group, which is often sub-divided into particular programmes. The diagram below describes how I created the categories from this source data. In this example, the Infrastructure function was created by aggregating six different programmes from three separate Departments.
Supplementary data was used to obtain estimated expenditures when the Revised Estimates contained insufficient detail. Under education, for example, the Revised Estimates contain only a joint figure for expenditure on primary and secondary education. In order to obtain an estimate on how much is spent on each area individually, I returned to the 2012 edition of the Revised Estimates, which listed expenditure on primary education and secondary education separately. From the 2012 edition, I ascertained that the ratio of primary education expenditure to secondary education expenditure was 53/47. After stripping out certain expenditures such as school transport, teacher education and administration from the 2013 data, I then applied this 53/47 split to the remainder.
Similarly, in the area of Health, supplementary data from the HSE was used to divide up spending on HSE Regions between Hospital Services and Community Services.
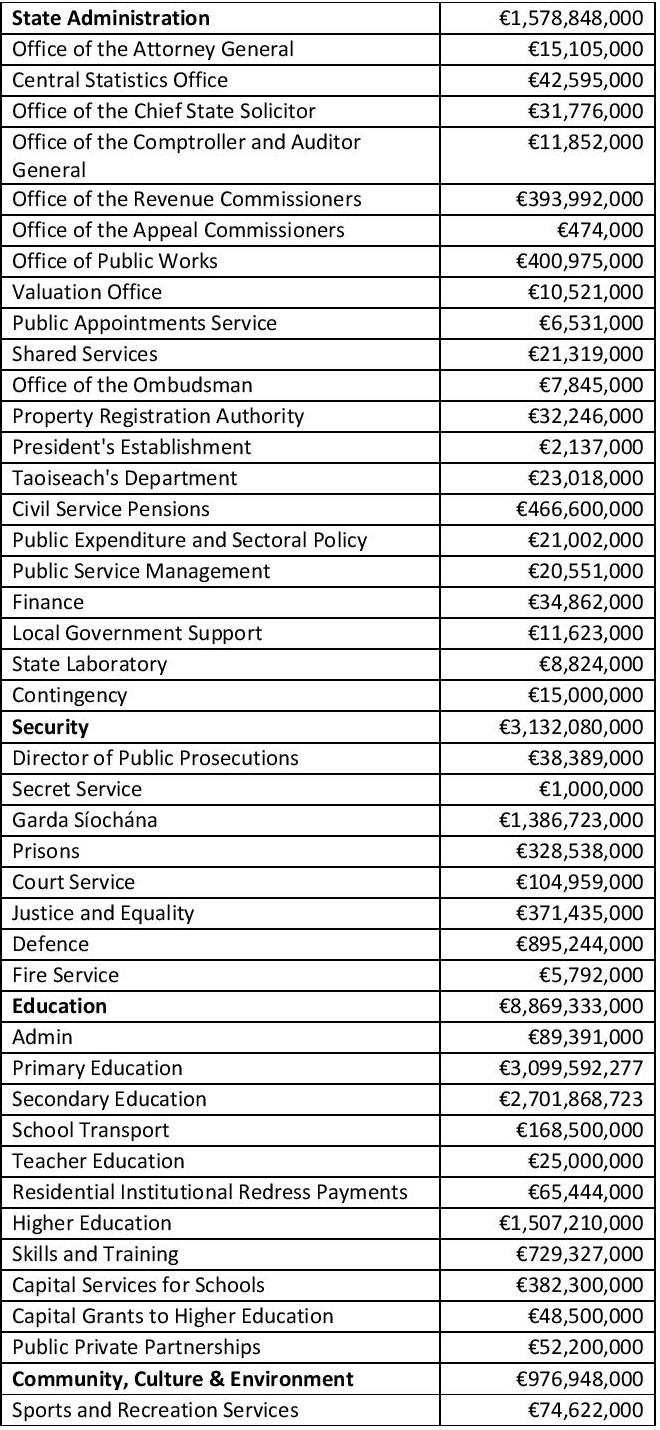
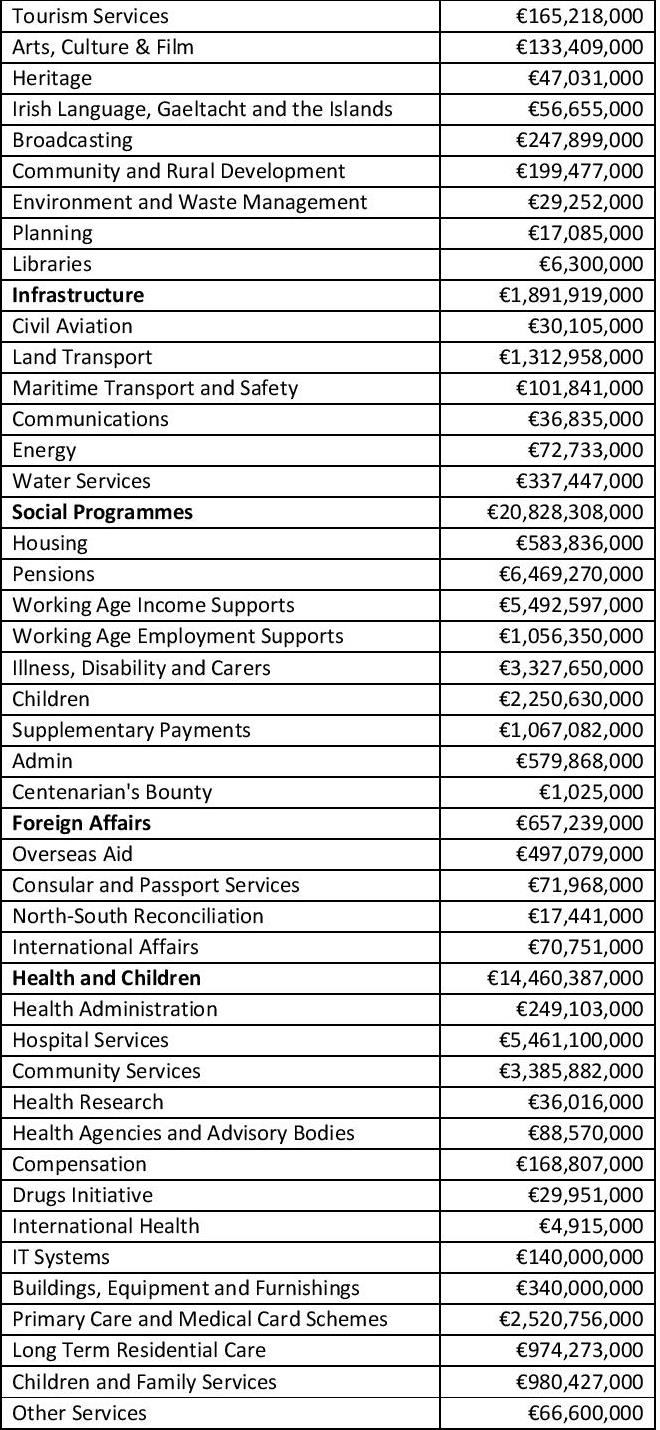
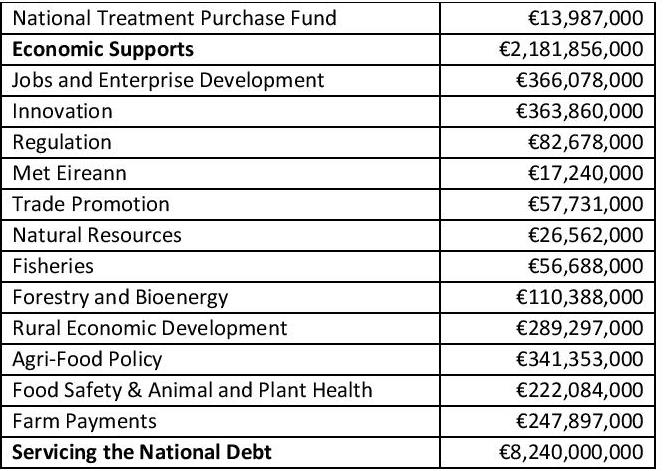
All expenditure data is provided in the Appendix below.
Taxation
When inputting their data via the slider, users have two choices: they can either input how much tax they pay directly, or they can input their income and the app will calculate how much of that income is paid in tax. This calculation is based on the income of a single PAYE worker, and relates to taxes on income only – Income Tax, PRSI, and Universal Social Charge. The goal of Where Does Your Tax Go? Is not to tell the user exactly how much they pay in tax – this would be impossible using only data on income. The amount one pays in taxes such as VAT, Excise Duties, Property Taxes, Capital Taxes and other government charges can vary significantly between different people, even if they are on the same level of income. If the user so wishes, they can input any amount of taxation they believe applies to them.
The Team:
Cormac O’Sullivan, publicpolicy.ie: concept, data, calculations
Maryrose Lyons, Brightspark Consulting: project management, marketing
David Henry, Modus: web design
Alan Nolan, RedBird Creative: icon design (all 106 of them)
Appendix: Expenditure Data
About author
79 Merrion Square, Dublin 2, Ireland
tel: 353 (1) 676 0414 | email: info@publicpolicy.ie
Company registration number: 504956
Privacy Policy | Chairman's Blog | Events | Video | Public Policy Documents | News Property Tax Ireland | Pension Reform Ireland | Water Charges Ireland