
A Survey of the Benefit System in Ireland
21 Oct 2014
Overview
This document surveys the benefit system in Ireland, providing detail on how much is spent on social payments as well as a breakdown of spending for individual programmes. A brief description of the Irish benefit system is presented below. The detailed report can be downloaded from here.
Description of the Social Security Benefit System
The Department of Social Protection (DSP) is responsible for the provision of social security in Ireland. It is one of the largest public service organisations in the country 1.
The DSP spent 20.3 billion on schemes, services and administration in 2013, a decrease of 2.4 percent compared to 2012. Table 1 illustrates the trend of annual increases in social welfare expenditure from 2008 to 2011, after which it plateaus and even shows a marginal decrease.
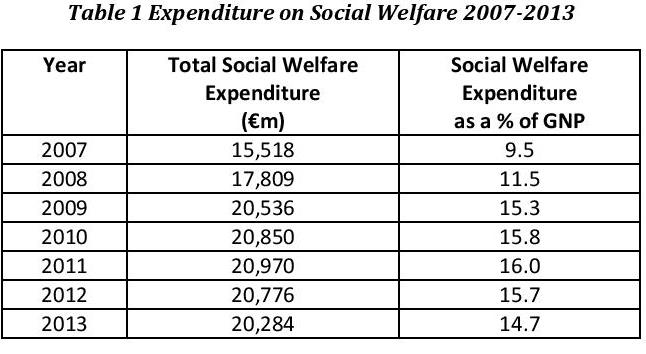
Source: DSP (2014) Statistical Information on Social Welfare Services 2013, Table A2.
The total number of recipients of weekly social welfare payments in 2013 was 1,467,918. When qualified adults and children are included, there were over 2,273,003 beneficiaries in 2013. Figure 1 shows the trend in recipiency and beneficiary numbers from 2004-2013. Again, we can see an increase in the two rates from 2008 to 2011, however after 2011 beneficiary rates increase while recipiency rates remain relatively constant.
Figure 1: Recipient and Beneficiary Numbers 2004 to 2013
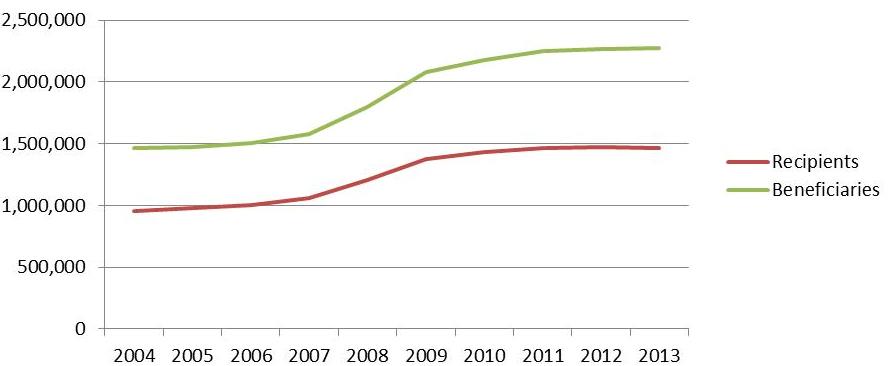
Source: DSP (2014) Statistical Information on Social Welfare Services 2013, Table A8
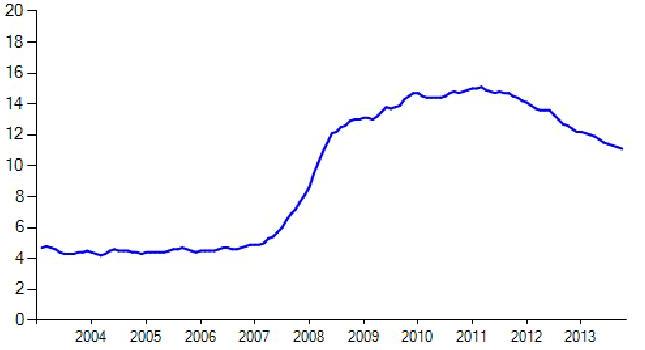
It must be noted that falling unemployment levels are driving the reduction in recipiency rates, and subsequently the reduction in total social welfare expenditure between 2012 and 2013. As can be seen from figure three below from the CSO, the Seasonally Adjusted Standardised Unemployment Rate (SUR) decreased from 15% at the start of 2012 to 12.1% at the end of 2013, a significant reduction. The current SUR, as of September 2014, stands at 11.1%.
Owing to this significant reduction in unemployment, along with projected trends in payment values and impact of changes from the preceding budgets, a reduced level of expenditure of €19.6 billion has been provided for the Department in the ‘Revised Estimates Volume’ to spend on its schemes, services and administration2 .
Figure 2: Seasonally Adjusted Standardised Unemployment Rates 2004-2014
Payments by the DSP go to three main groups of people (or programmes); children, people of working age and retired and older people. Figure 3 below shows the percentage of DSP spending that goes to each of these three cohorts.
Figure 3: Expenditure by recipient type as % of DSP total expenditure
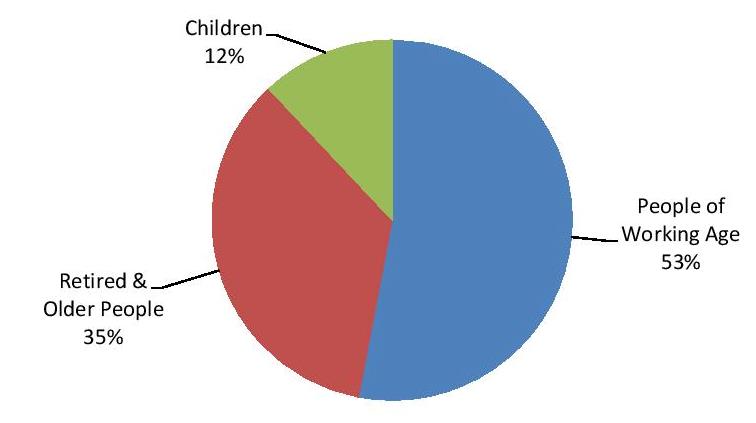
Source: Department of Social Protection Annual Report 2013, Table 1.
‘People of Working Age’ represent the largest proportion of expenditure (53%), which amounted to €9.9 billion in 2013. Spending on ‘Retired & Older People’ and ‘Children’ amounted to €6.4 billion and €2.2 billion in 2013 respectively 3.
Table 2 Total Recipients & Expenditure by Scheme 2013
[table id=38 /]
Source: DSP (2014), Statistical Information on Social Welfare Services 2013 (Section A).
The three schemes with the highest expenditure are the Contributory State Pension (€3.9 billion), Jobseekers Allowance (€3.1 billion) and Child Benefit (€1.9 billion). These payments alone accounted for 44 percent of the DSP’s total spending in 2013.
Notes:
1 Source: Department of Social Protection Annual Report 2012.
2 Source: DSP(2014) Annual Report 2013
3 Note: The figures used are that of the ‘2013 Provisional Outrun’ estimates from Table 1 of the DSP Annual Report 2013
4 Included in this benefit is the Free Electricity Allowance, Free Television Licence, Free Telephone Rental and Gas Allowance
5 Included in this broad category is expenditure on employment support services and expenditure on all the employment programmes (including the listed expenditure on JobBridge and community employment). See Table A3 and A4 in DSP (2014) for further details.
6 The State pension (transition) is currently being abolished. From the 1st of January 2014 it is no longer paid where a person reaches 65. Thus, the State pension (transition) will no longer be payable for claimants whose date of birth is on or after the 1st of January 1949. If you qualified for the State Pension Transition before1 January 2014 you remain entitled to it for the duration of your claim (1 year). Therefore the data on expenditure and total recipients of this scheme in 2012 that is presented below masks considerable changes in the scheme that will have a significant impact on these figures.
7 The number of Respite Care Grant recipients reported is the total number in payment and include those who are not in receipt of any other Carer’s payment
8 Includes Heating, Diet and Travel
About author
79 Merrion Square, Dublin 2, Ireland
tel: 353 (1) 676 0414 | email: info@publicpolicy.ie
Company registration number: 504956
Privacy Policy | Chairman's Blog | Events | Video | Public Policy Documents | News Property Tax Ireland | Pension Reform Ireland | Water Charges Ireland